Week 8 : Introduction to Jamovi
Welcome to this practical session! This week you will be introduced to Jamovi. You will use Jamovi throughout your degree for statistical analysis, so it is very important to get familiar with it!
JAMOVI has inbuilt functions which can be used to investigate and manipulate data, and to perform the majority of statistical tests used in psychological research. Each task you perform in JAMOVI will generate an output which will support your research decisions, such as choosing a statistical test or deciding whether to reject a hypothesis.
JAMOVI will already be on the computers on Campus but if you want to use it at home too you will need to download and install it on to your personal laptop or desktop PC. The software is free and we recommend that you install it at home because you will need to use it a lot over the next three years, including for many of your assignments. As you can see on the JAMOVI website, there are versions for WindowsOS, MacOS and ChromeOS: https://www.jamovi.org/download.html
You can find instructions for how to install JAMOVI on your personal laptop or desktop PC here: https://docs.jamovi.org/_pages/um_1_installation.html
There is also a Cloud version here: https://www.jamovi.org/cloud.html
You will also be able to find a lot of information about how to use JAMOVI on their website and all of this is free to access. You should explore their website but this page could be particularly useful because it is a comprehensive User Guide: https://www.jamovi.org/user-manual.html
Learning Objectives
| Quantitative Methods | |
|---|---|
| Measures of central tendency | |
| Measures of dispersion and spread | |
| Measures of skew and normality |
| Data Skills | |
|---|---|
| Working with the Jamovi editor | |
| Computing descriptive statistics in Jamovi | |
| Plot basic graphs in Jamovi |
| Open Science | |
|---|---|
| Working with openly available research data |
Today you will just be familiarising yourself with the Jamovi interface and its layout / basic functions. Next week we will move on to using Jamovi for statistical analysis of data – so make sure you are comfortable with the layout and using the basic functions this week!
1. The Dataset
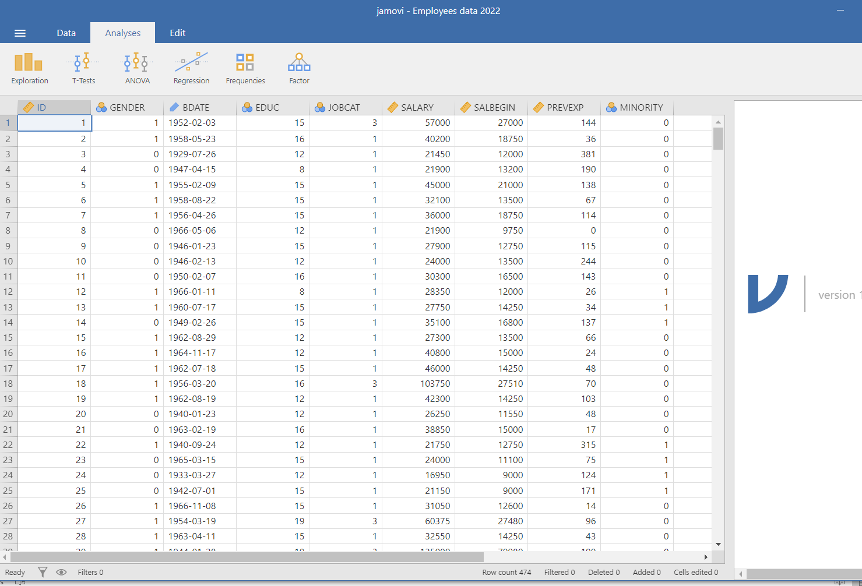
We will be exploring the dataset employees data that you can find on the CANVAS page under Week 8 of the computer labs folder of Research Methods A
2. The Challenge
We have a dataset of employees in a big data table. This raw data needs to be summarised and visualised so that we can turn this massive block of numbers into something intuitive.
We can generate a concise overview of the main characteristics of the data by computing and visualising a few key features from the data.
We’ll be working with Jamovi throughout this practical.
Working on campus? You can open Jamovi through AppsAnywhere, either open the desktop application through the start menu on a campus computer or Birmingham’s AppsAnywhere website.
Take a look at these frequently asked questions or ask your tutor if you get stuck.
Working on your own computer? You can install Jamovi (for free!) folling these instructions. Install the ‘Desktop’ application - not the ‘Cloud’ version.
3. Jamovi Basics
The instructions for installing and licensing JAMOVI on your personal computer are available above. To access JAMOVI once installed or when using Campus computers you will be able to find it in the start menu at the bottom left corner of your desktop (sometimes this will be in another location on your personal laptop or personal desktop PC – you know your device best!)
Once open, you will see the following screen. Note that if you are working with a later version of JAMOVI, the screen may look a little different e.g. in version ‘2.3.28 solid’ there is a tab called “Variables” before “Data” at the top of the screen. As researchers we work with statistical software which updates occasionally. Most of the changes are often cosmetic but sometimes options and functions move or are improved. You should be prepared to familiarise yourself with the changes each time they happen and JAMOVI update their user guides regularly to account for updates.
4. How to open an excel file in Jamovi
Let’s start by loading the dataset into Jamovi. You can download the file Employees data.xlsx from canvas.
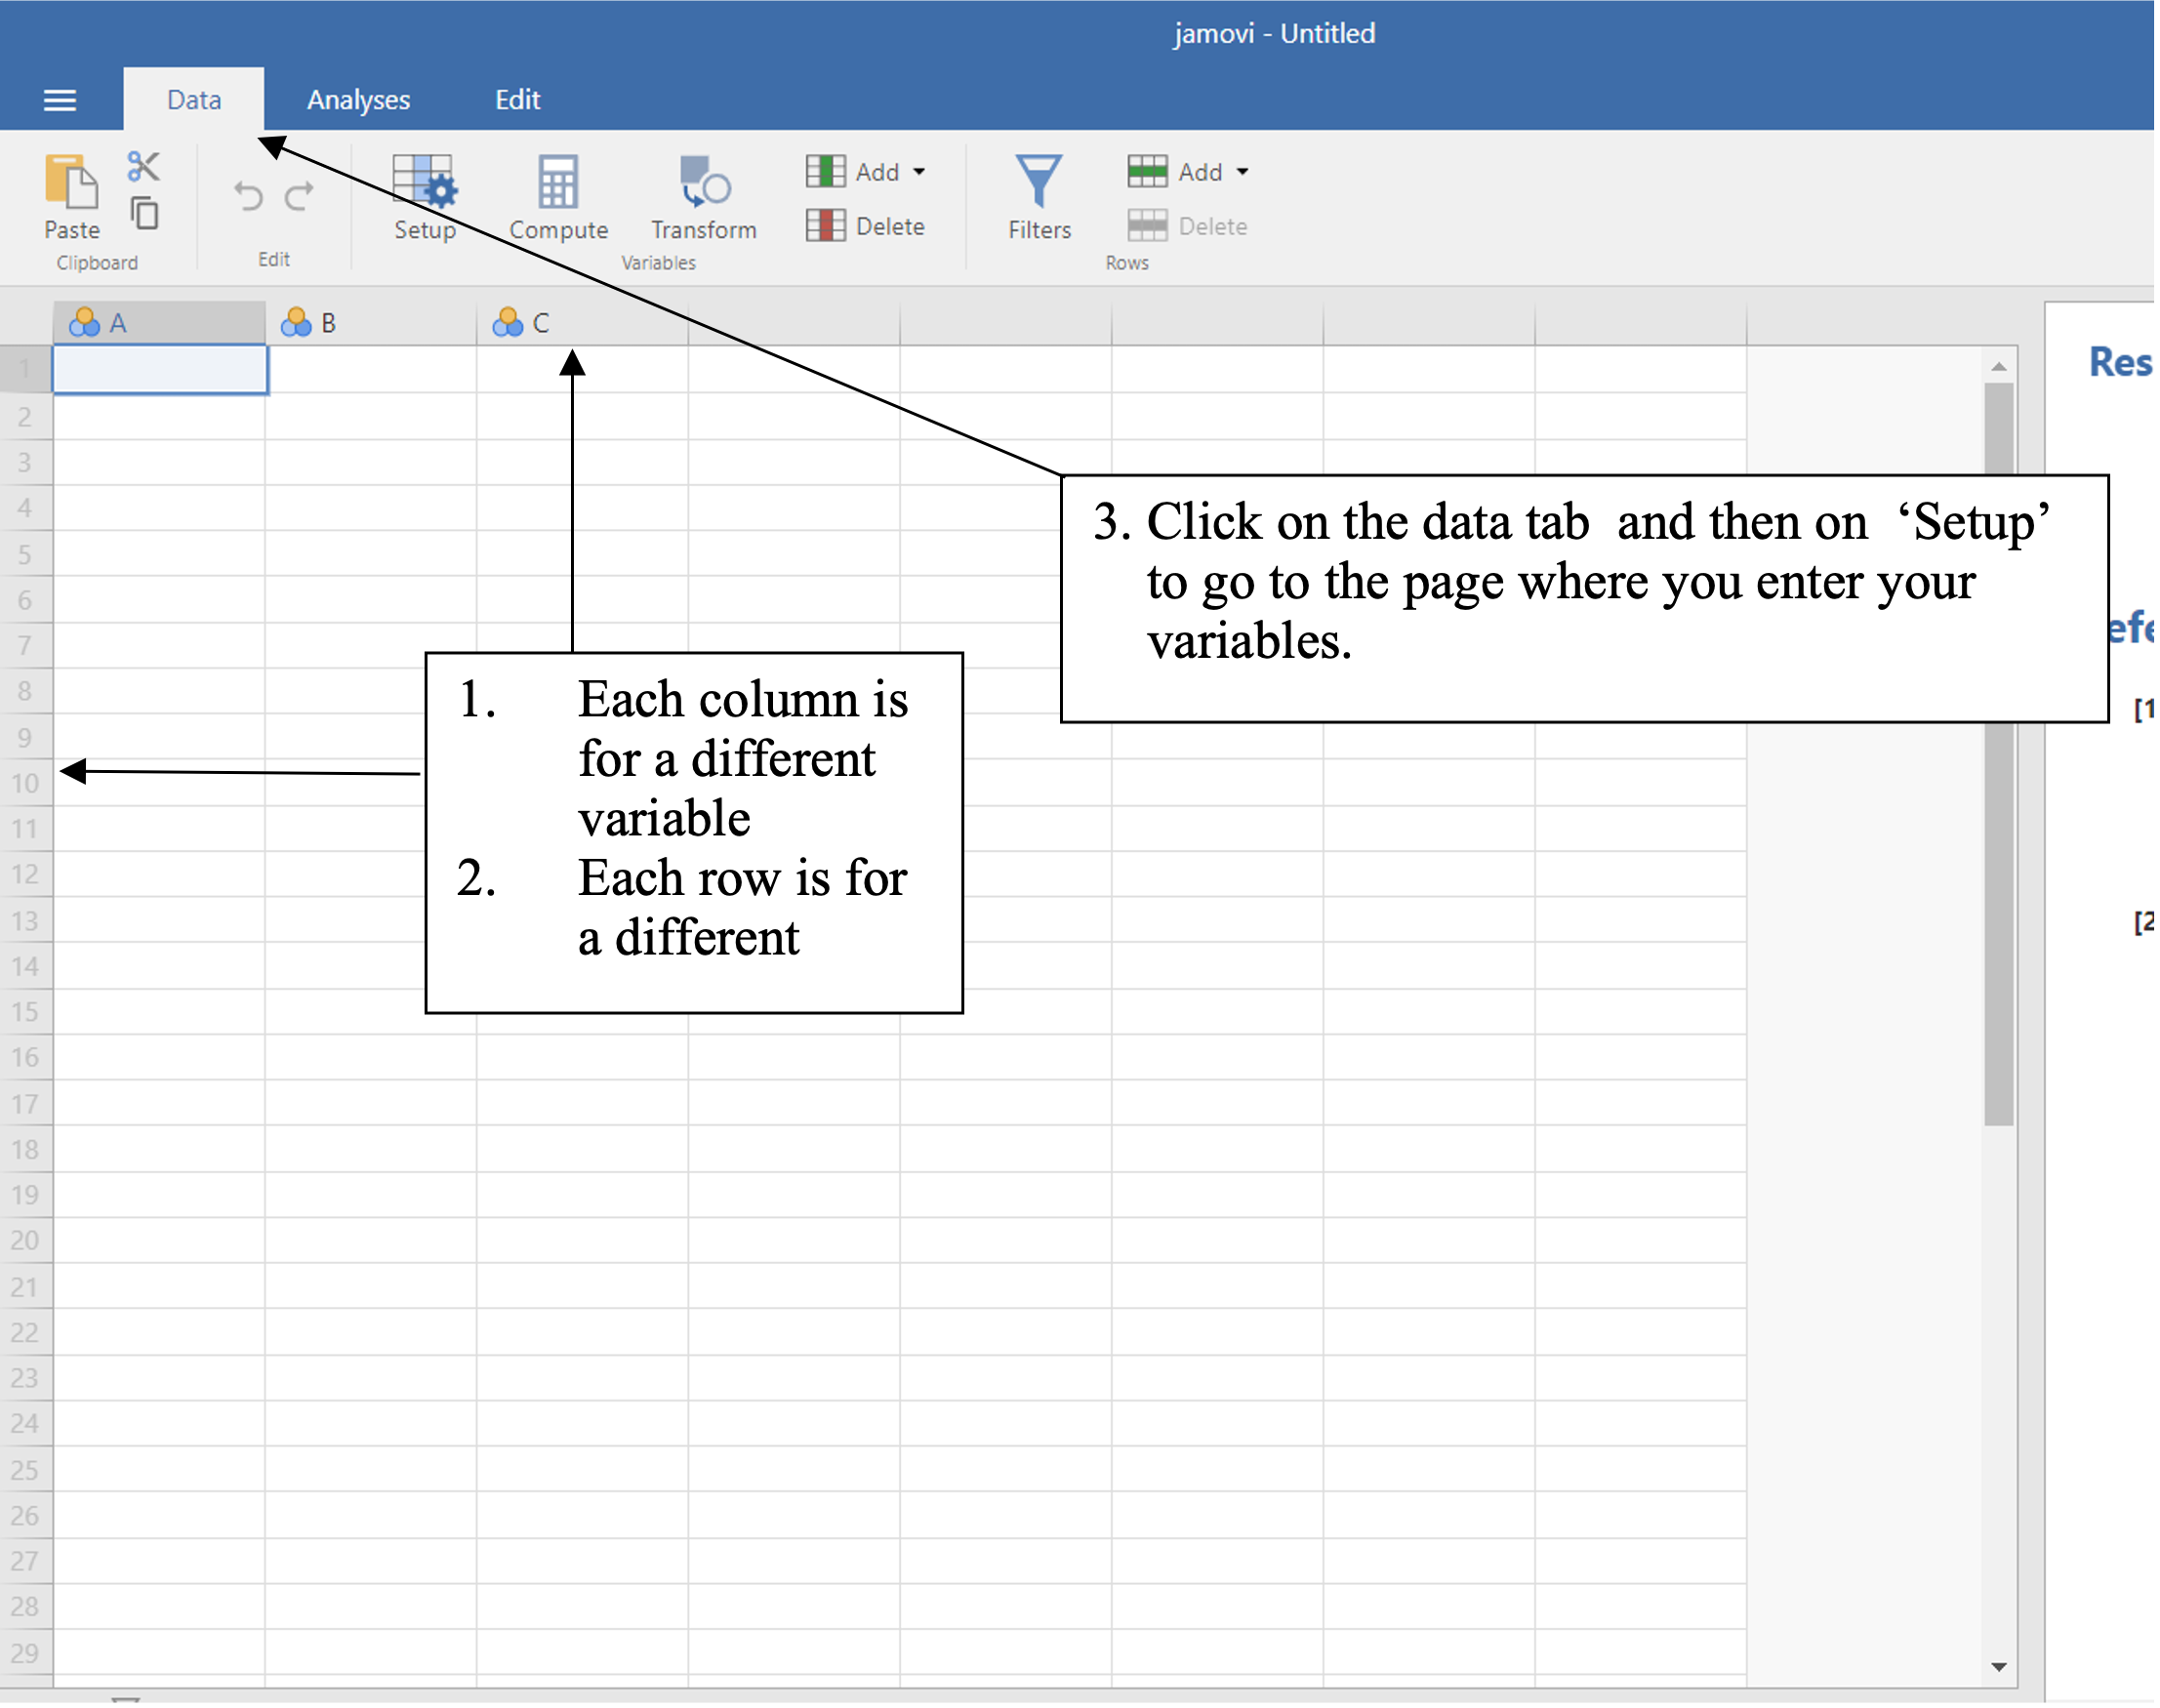
In Jamovi, click the 3 horizontal lines in the top left corner, click file, and click open. Find your data file and click to open.
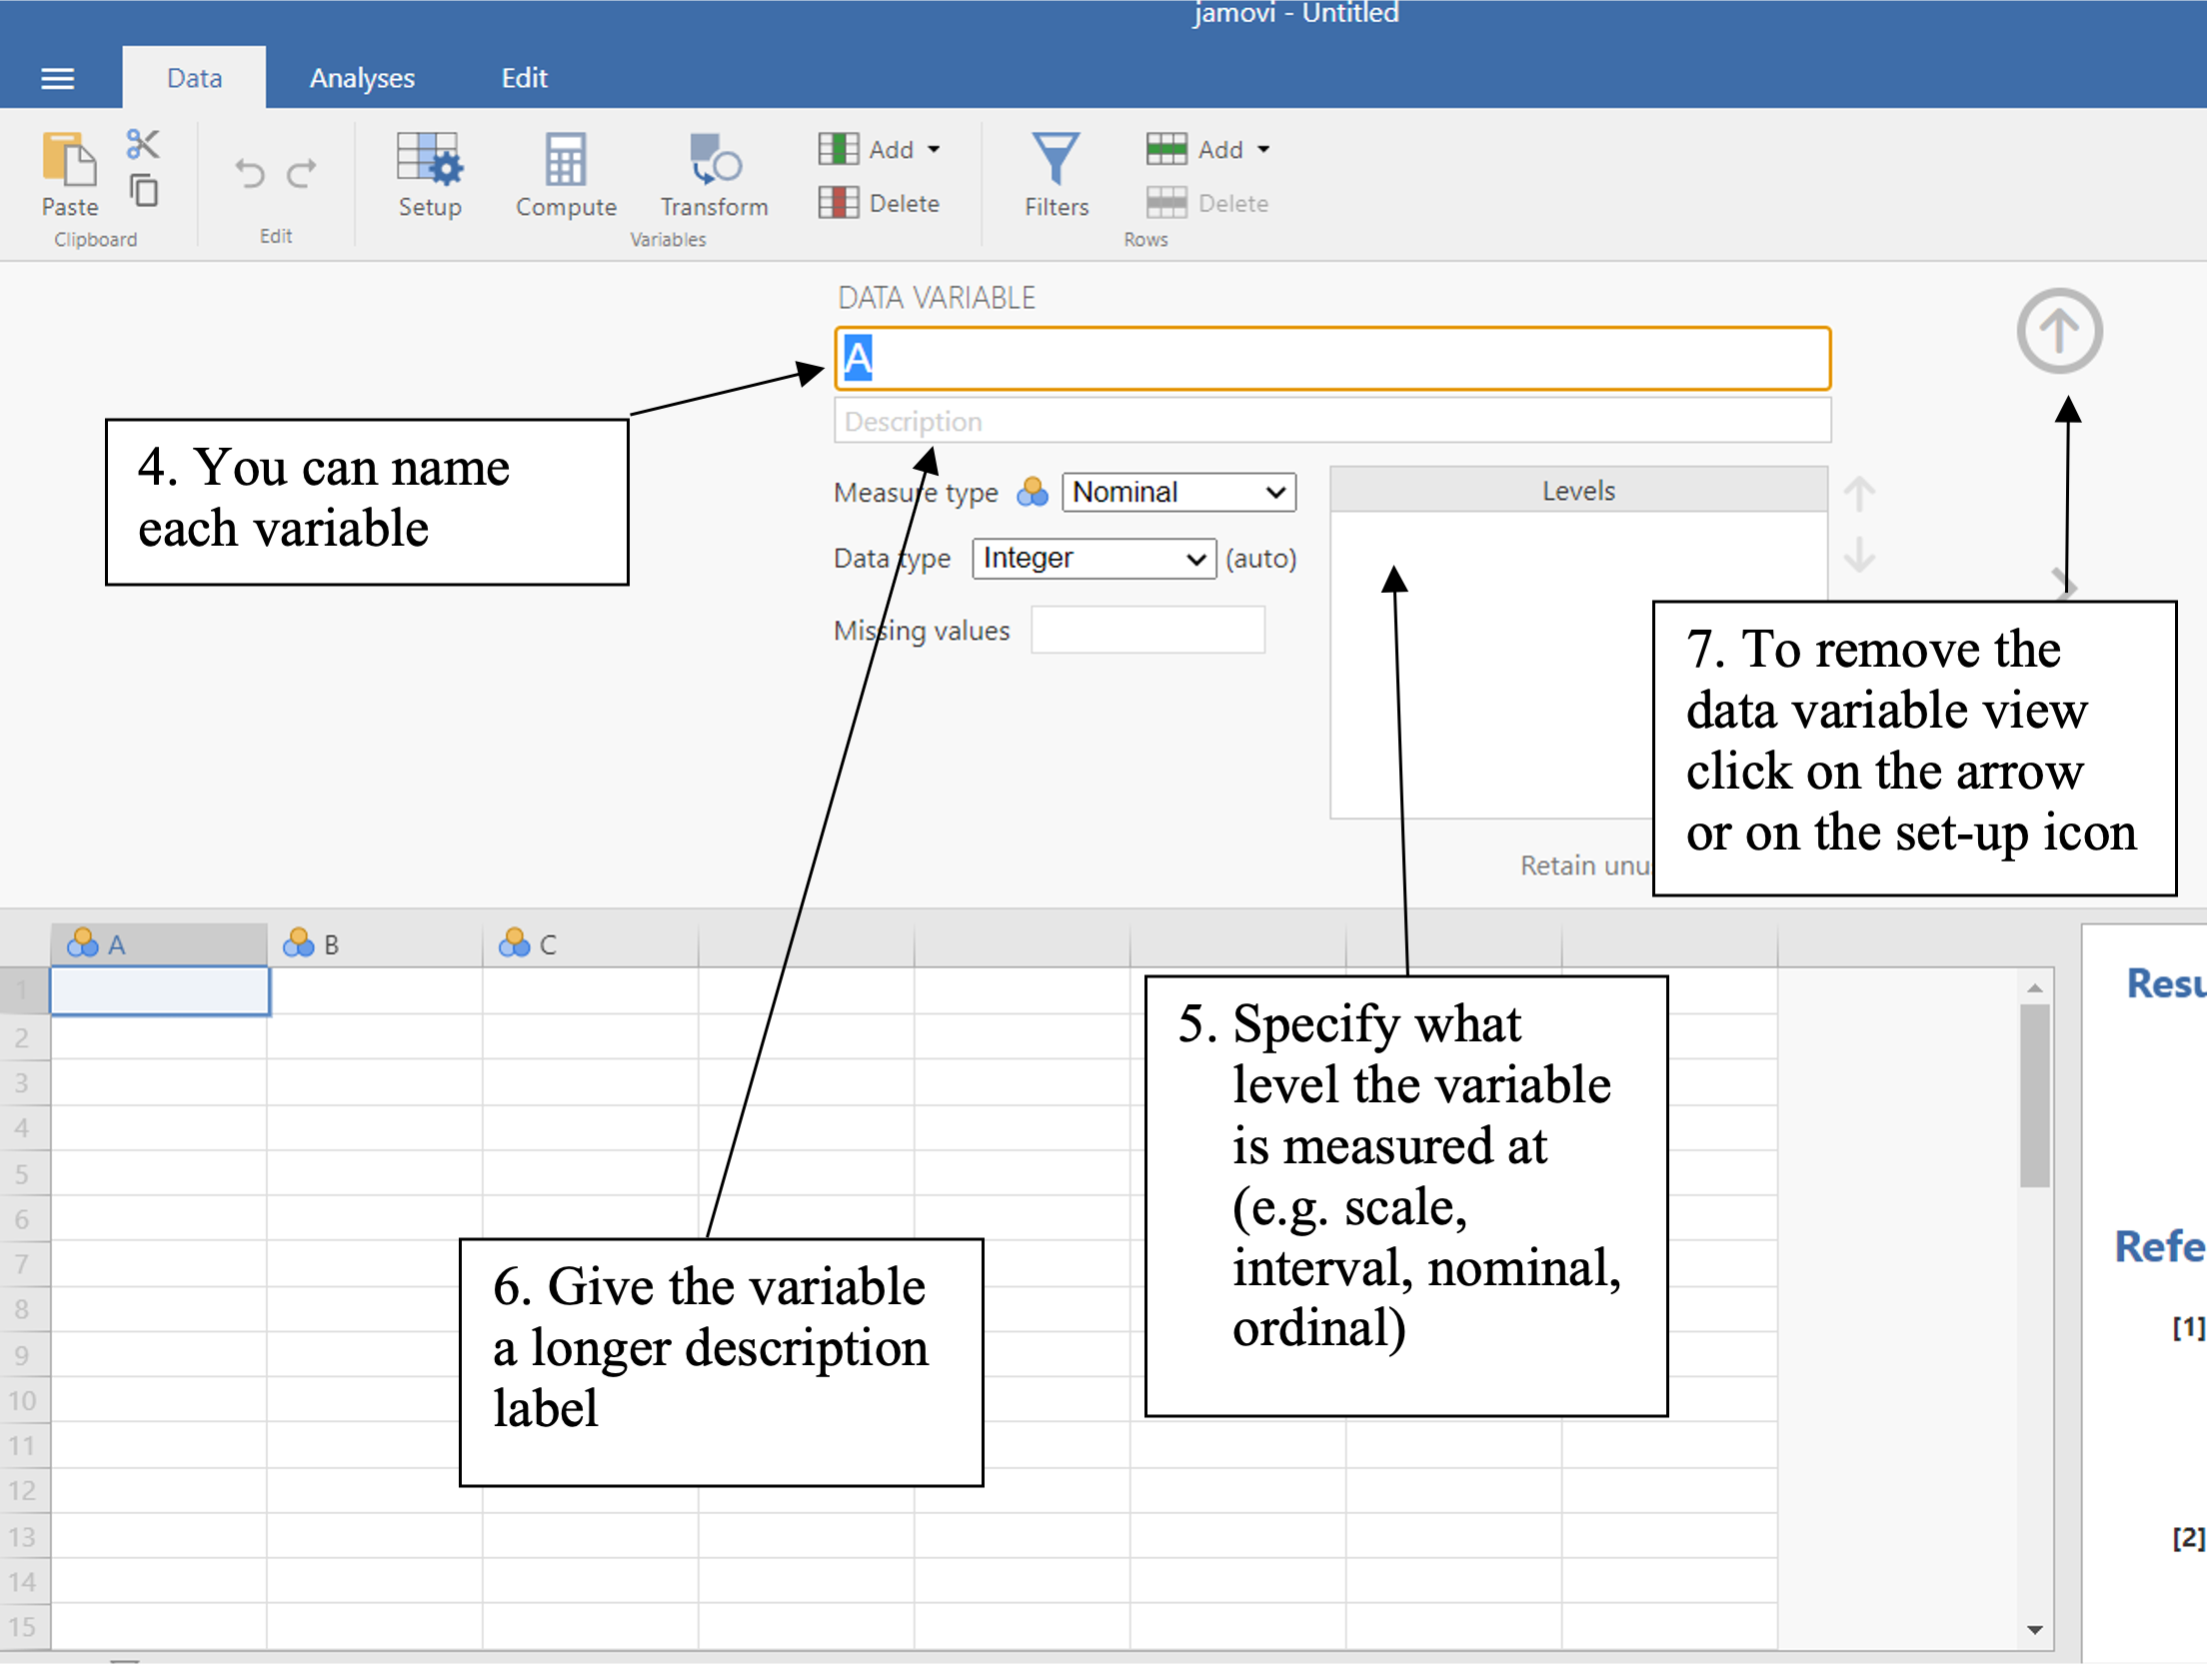
Click on the data tab and then on set-up to see the variable information
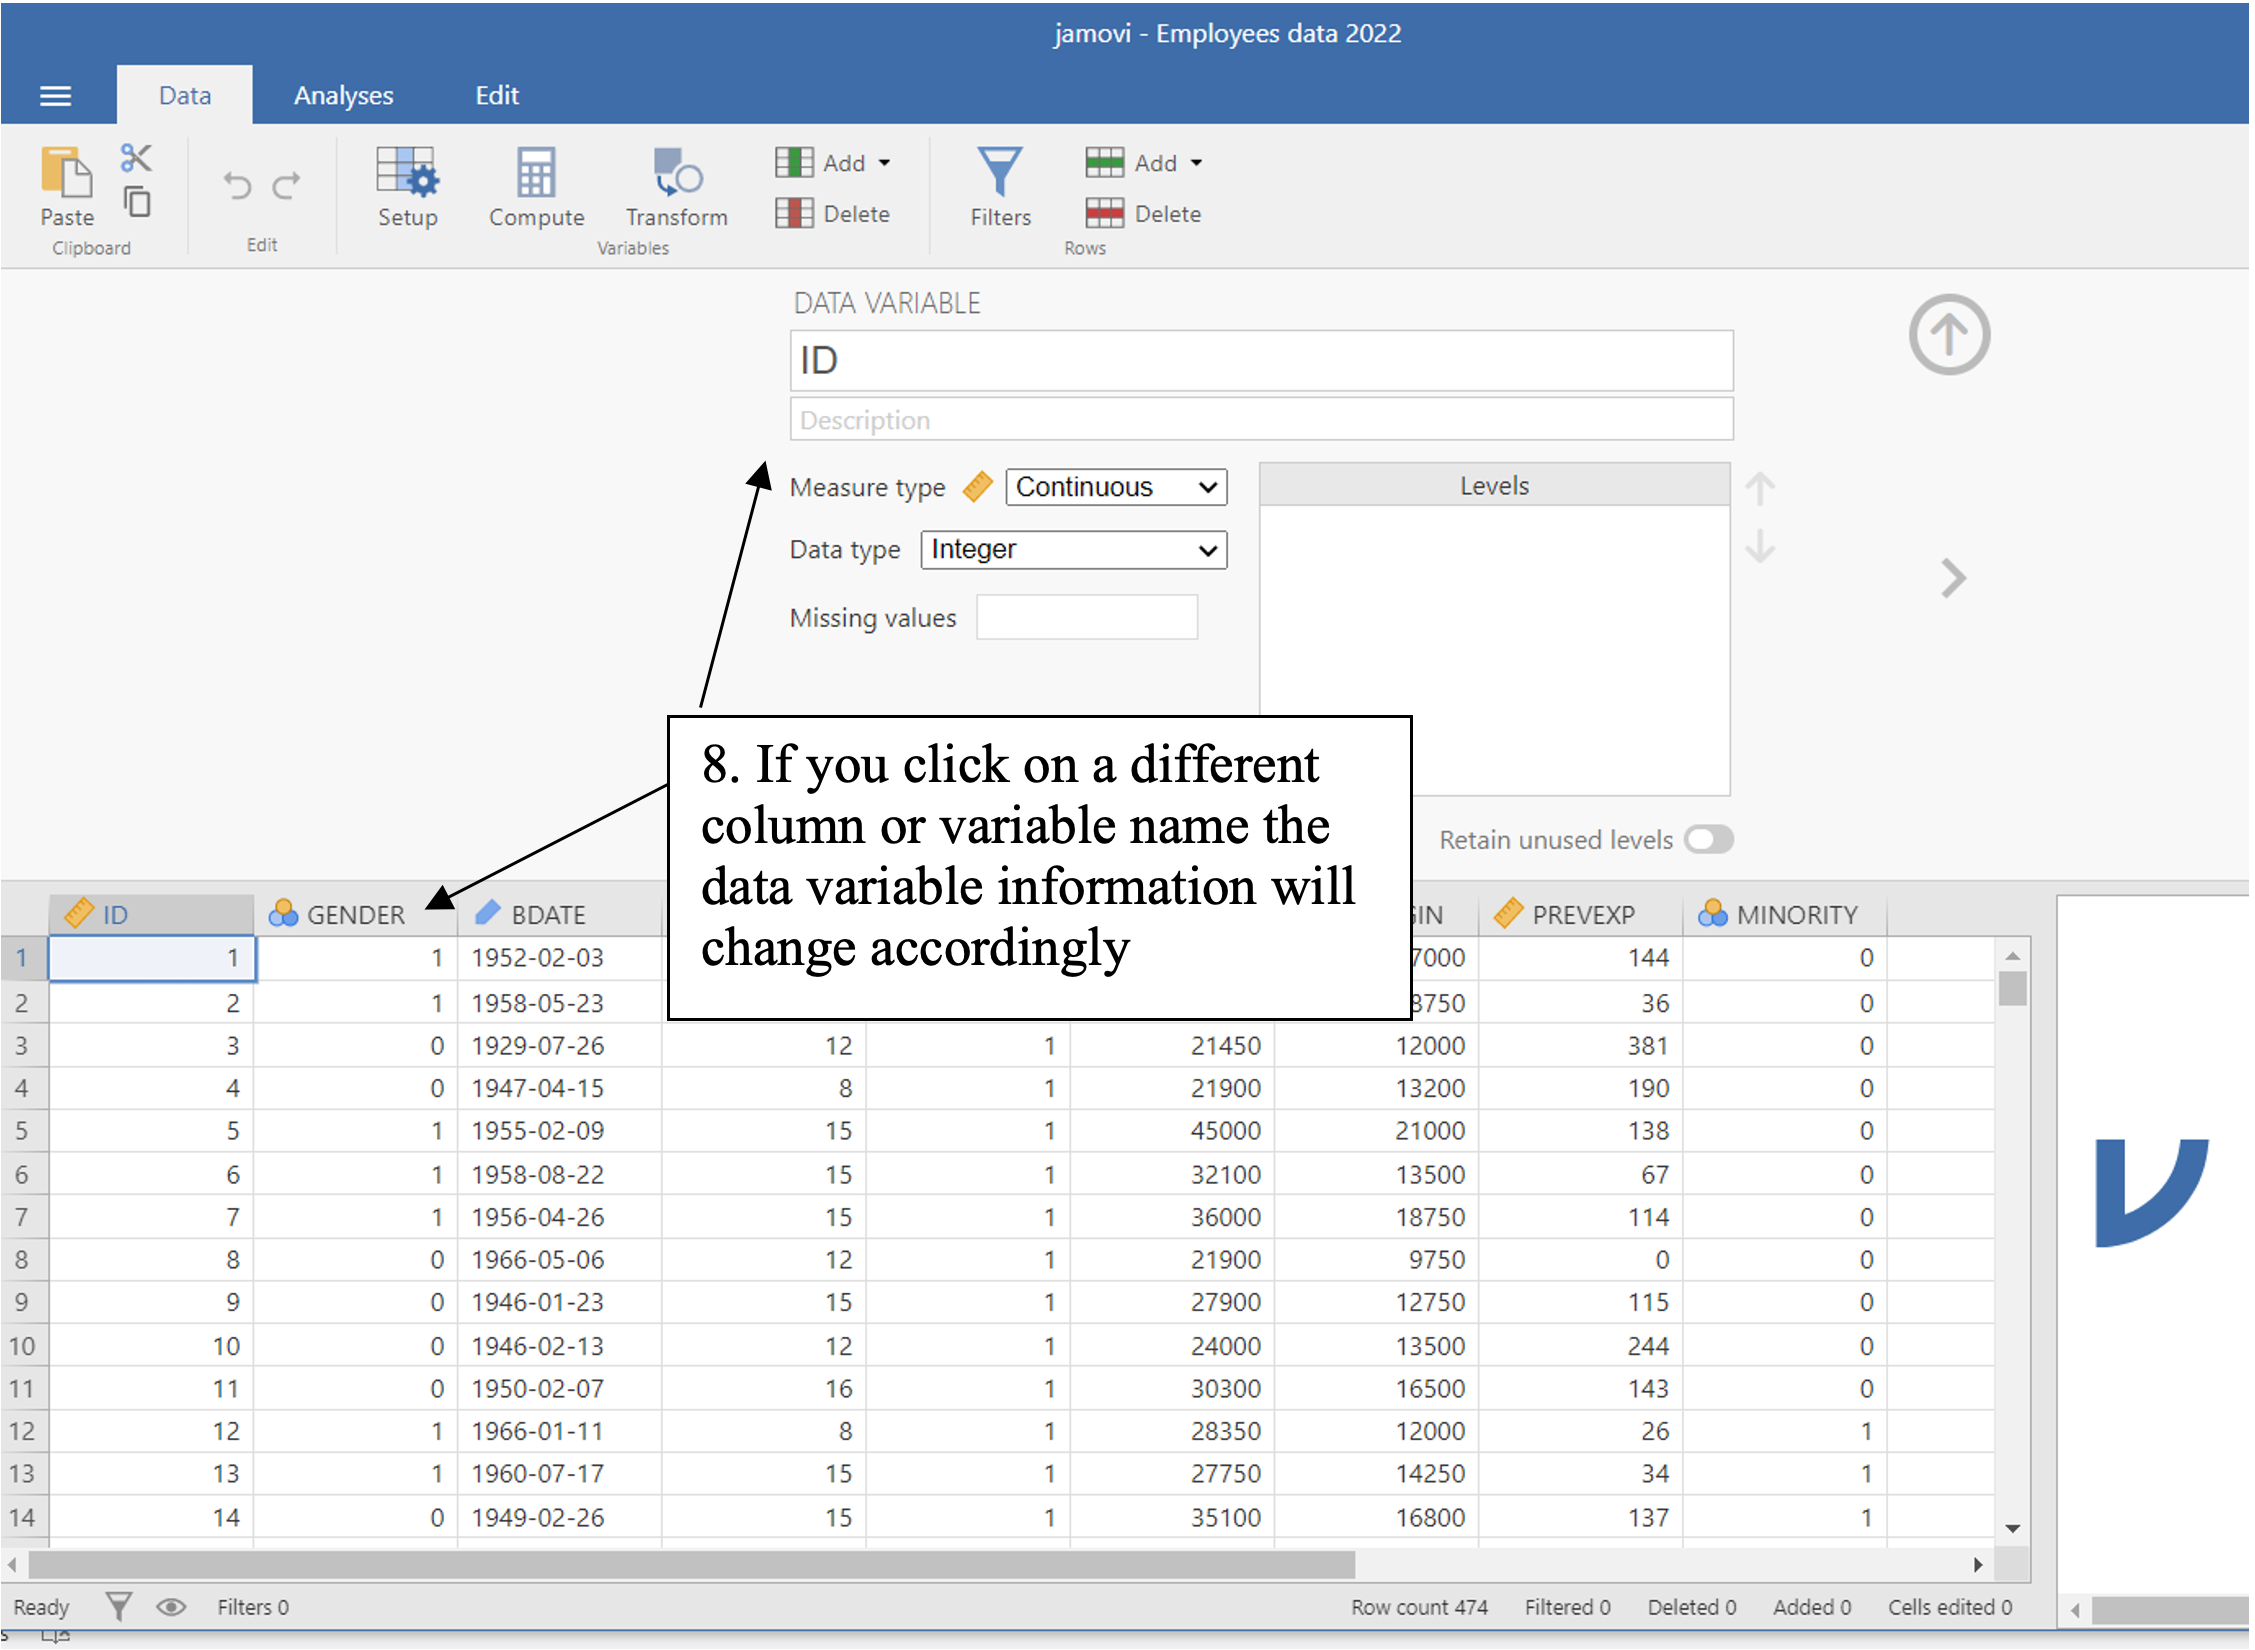
Try clicking on different column names to change the information you are presented with.
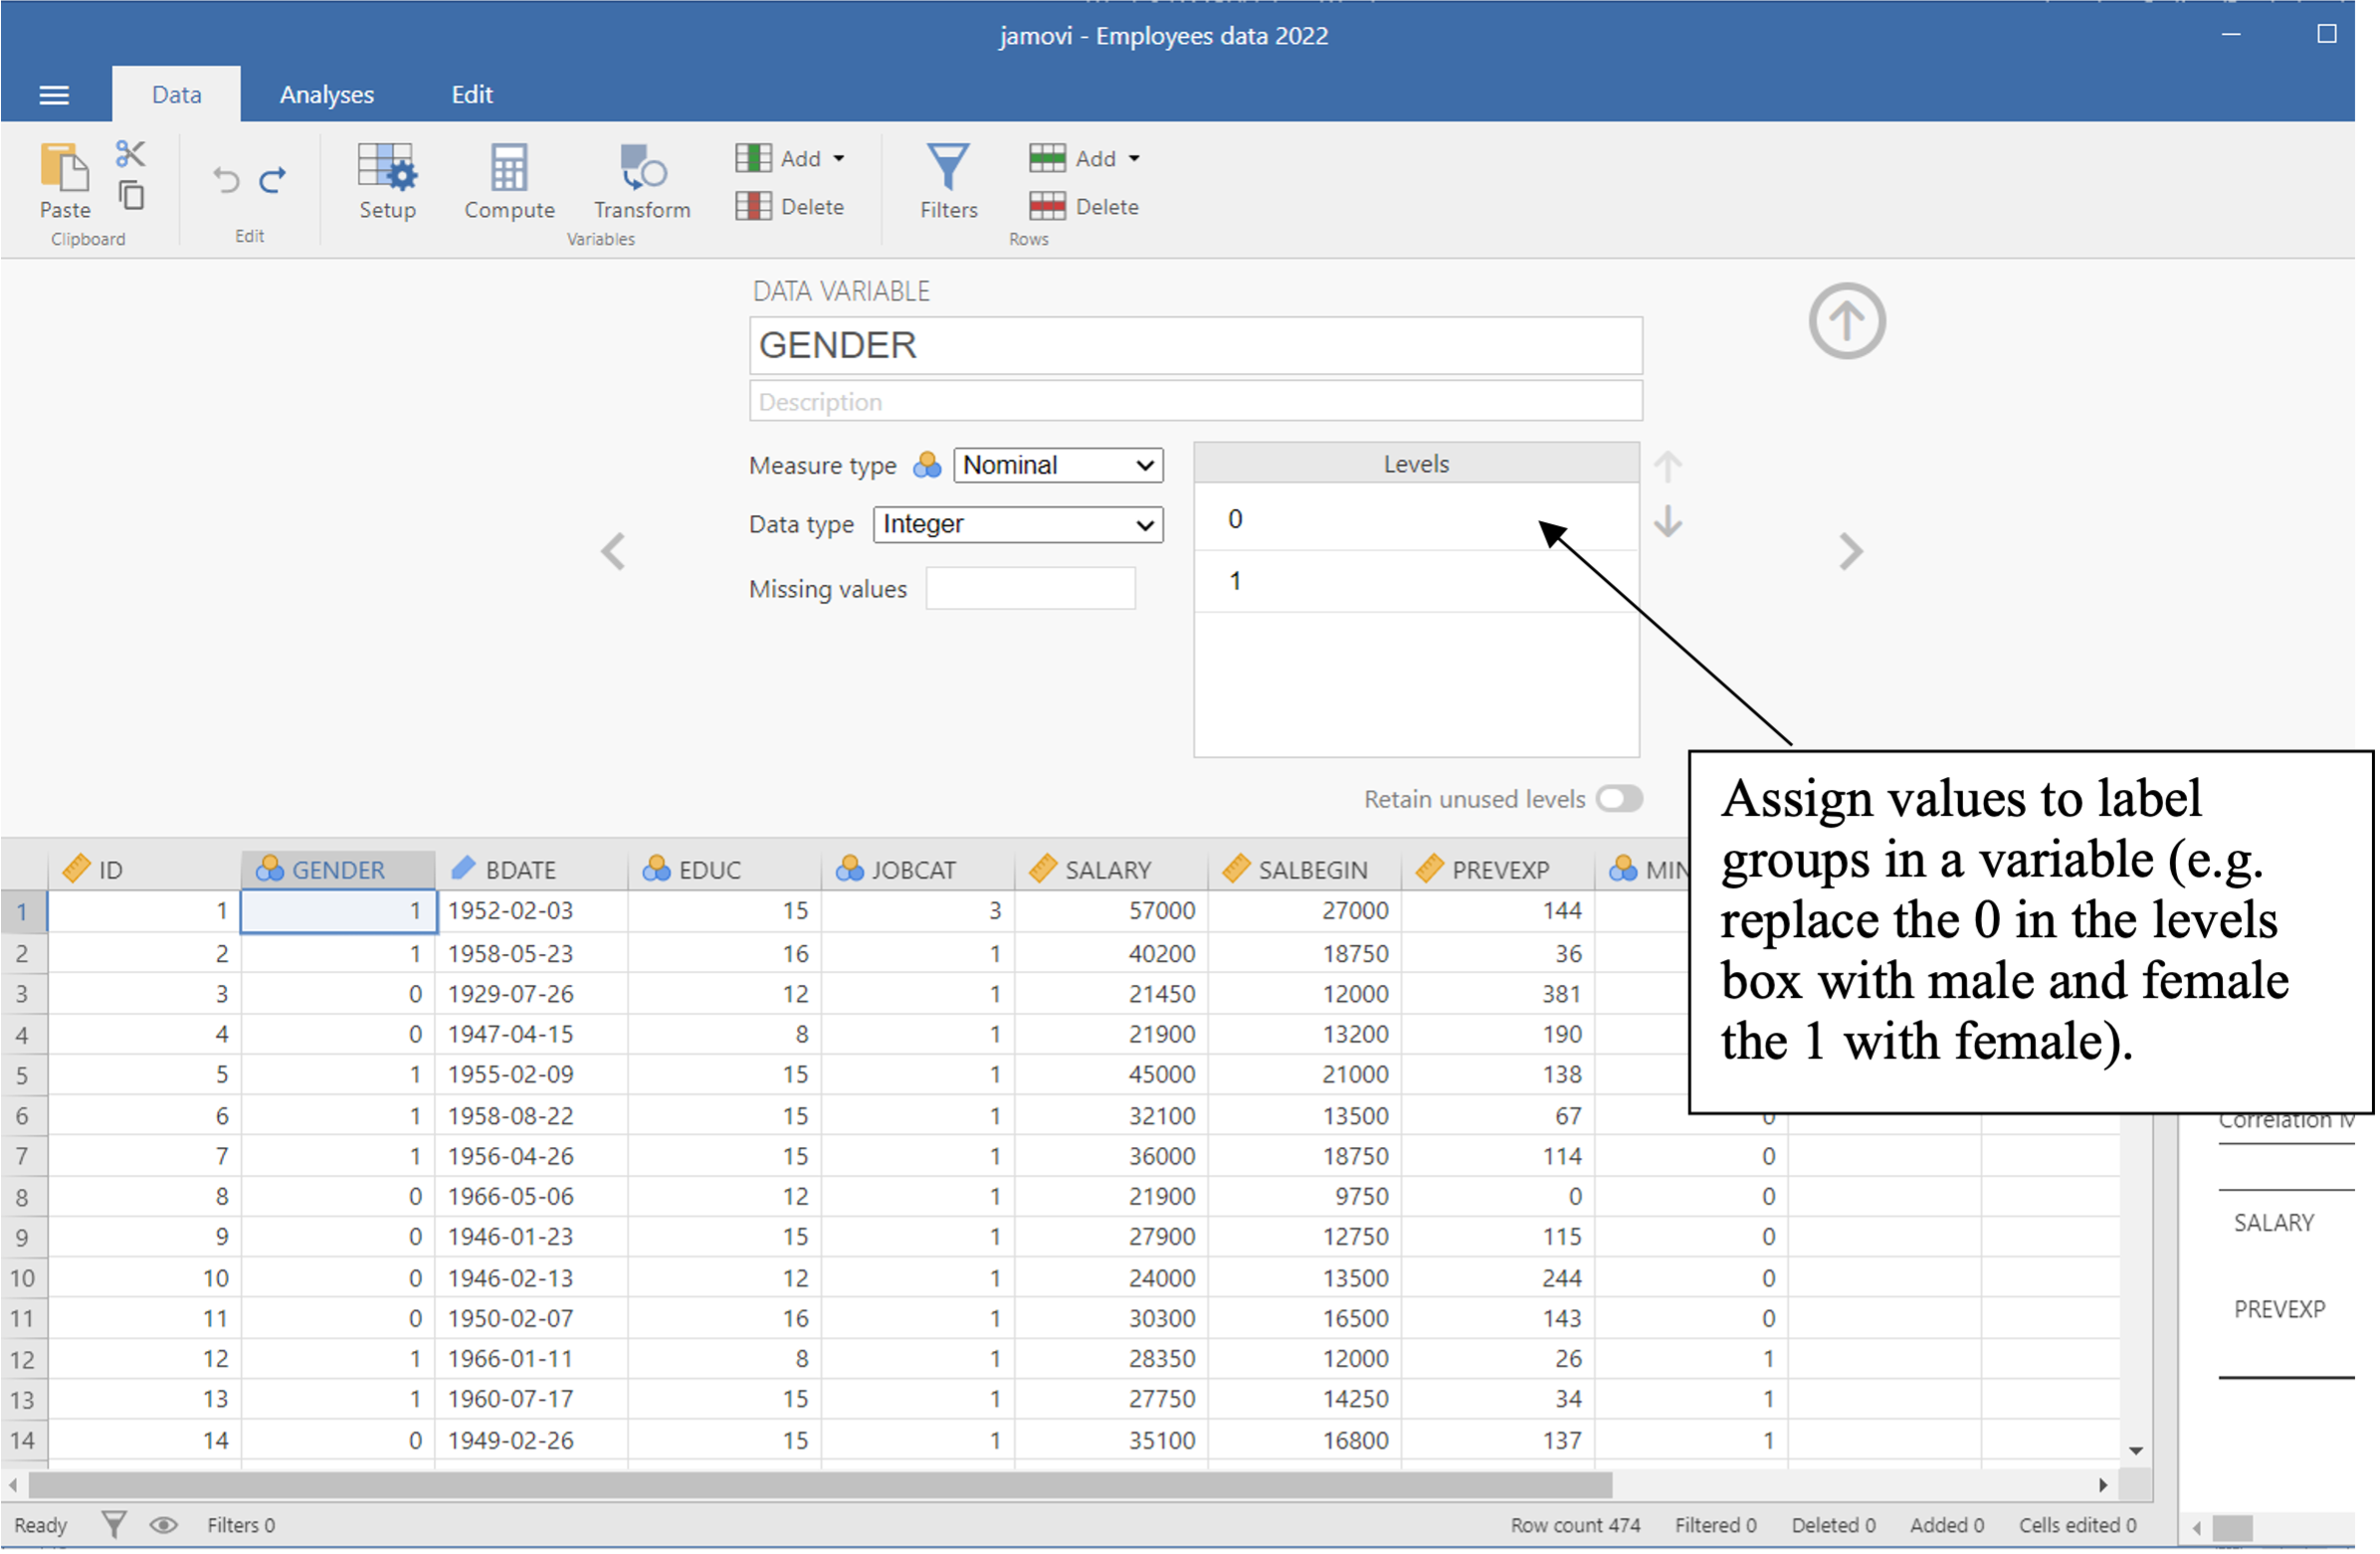
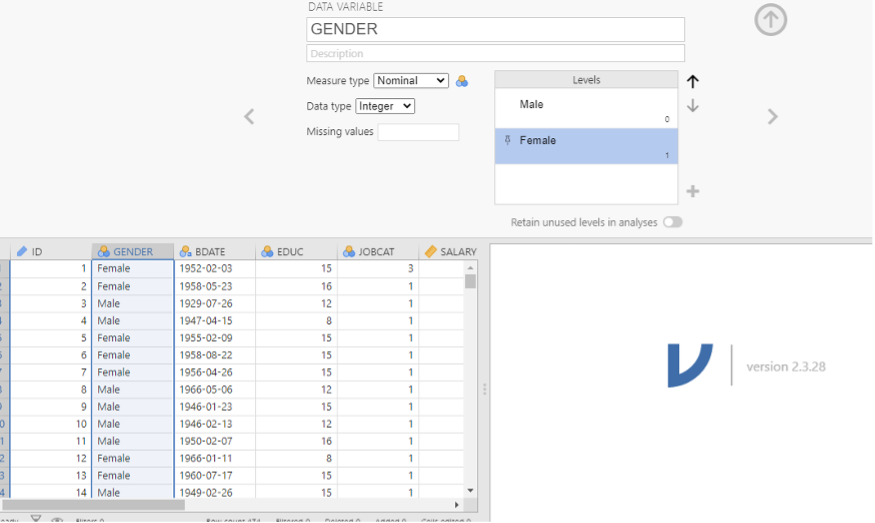
Try changing the labels for gender from 0 and 1 to something meaningful.
When you start to do things in JAMOVI another screen will also come up to the right of the data view. This is the Output screen which keeps track of what you are doing and all of your results. When you have undertaken some analysis you can click on the results from this screen and cut and paste them into your reports.
5. Exercises
Now it is time for you to explore the data. If you are unsure about any of these, please talk to the staff in your computer practical session.
Looking at JAMOVI, what do each row and column represent?
Each row represents .
Each column represents .
How many variables are there in this data set?
There are variables in the dataset.
How many levels are there in each variable?
Gender: .
Jobcat: .
Minority: .
Only the variables that are categorical have levels as these are the only variables that represent groups.
Check how many values are specified for each variable. E.g. Gender in this example only has two levels, male and female (which are represented by 1s and 0s) – look at the other variables as well. It is actually bad practice by the researcher to only list two potential labels for gender identity. Our research should be inclusive; this question isn’t inclusive because it excludes anyone who does not identify with one of these labels.
When you come to do your own research, it is incredibly important that you design your study well before you collect any data. How you design your study will determine what analyses you can perform, what hypotheses you can test and what conclusions can be drawn. If you don’t design your study in a way which allows you to collect the data you need, you won’t be able to analyse it how you intended, test your hypotheses or accomplish your aims/objectives. Therefore, you need to get it right because you can’t change it afterwards.
What type of variables (ordinal, scale (continuous), nominal) are there in the dataset?
Gender: .
Bdate: .
Educ: .
Jobcat: .
Salary: .
Salbegin: .
Prevexp: .
Minority: .
Your variables are not always imported as the correct variable type. In this case Bdate has been imported as ID which isn’t one of our variable types. What should you change this to?
Bdate: .
Please change this on your dataset.
When conducting statistical analysis for your research, you need to ensure that your variables are set to the right type. Otherwise, your analysis may not work correctly.
6. Descriptive statistics exercises
For the next few exercises you need to run some short analysis to get some descriptive statistics. Go to Analyse -> Exploration -> Descriptive statistics. Put Education and Job Category into the right-hand box. See the results appear in the right-hand window.
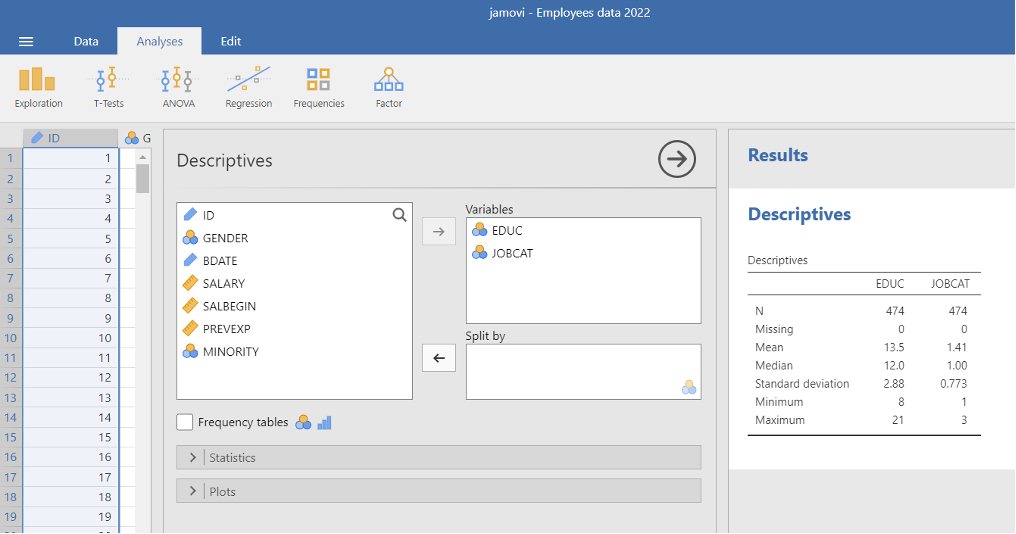
What is the mean education?
Mean educ: .
Now try putting gender in the ‘split by’ box and see what happens to the output
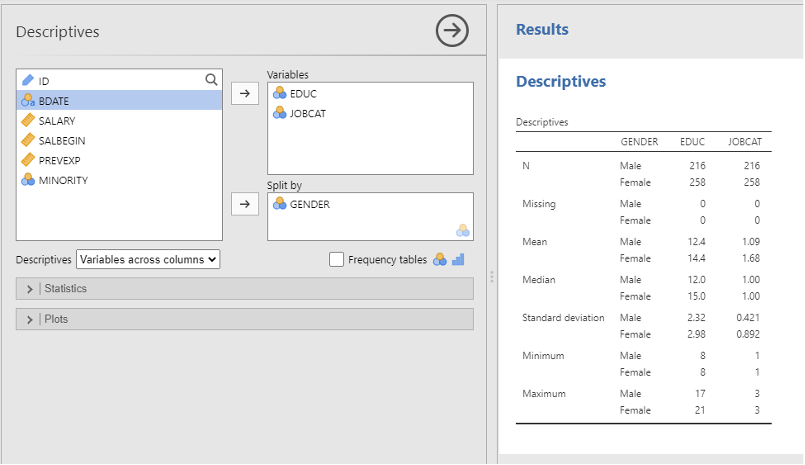
What is the mean education split by gender?
Mean education men: .
Mean education women: .
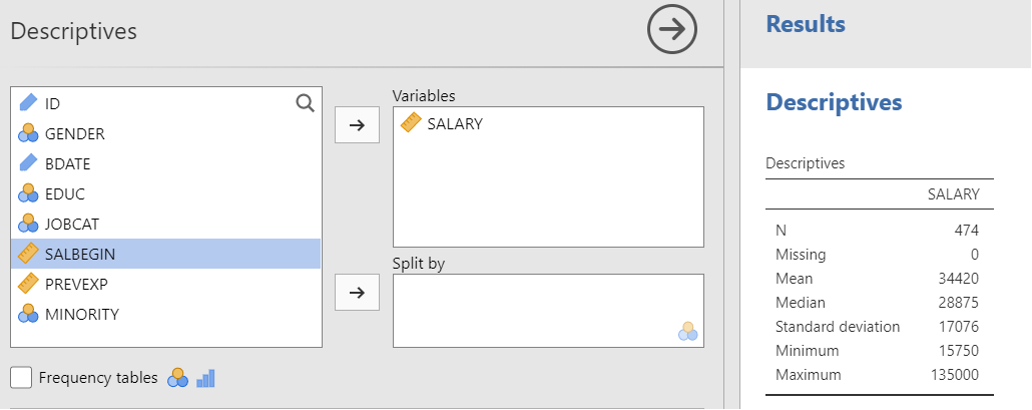
Add labels to the variable JobCat where 1 = Manual, 2 = Office and 3 = Corporate. Go to Analyse -> Exploration -> Descriptive statistics. Put Salary into the right-hand box and Press OK. Look at the output
Now do the same again but split by JobCat.
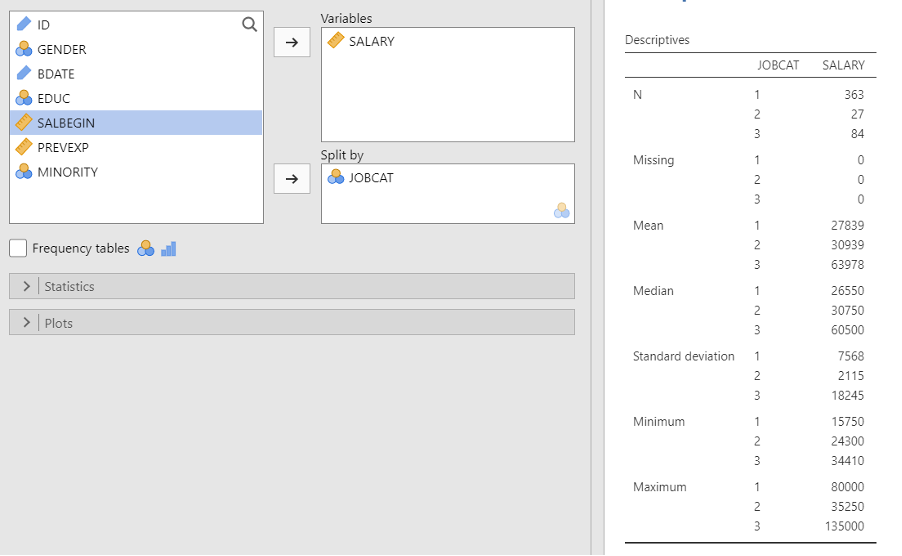
What are the mean salaries for each group?
Group 1: .
Group 2: .
Group 3: .
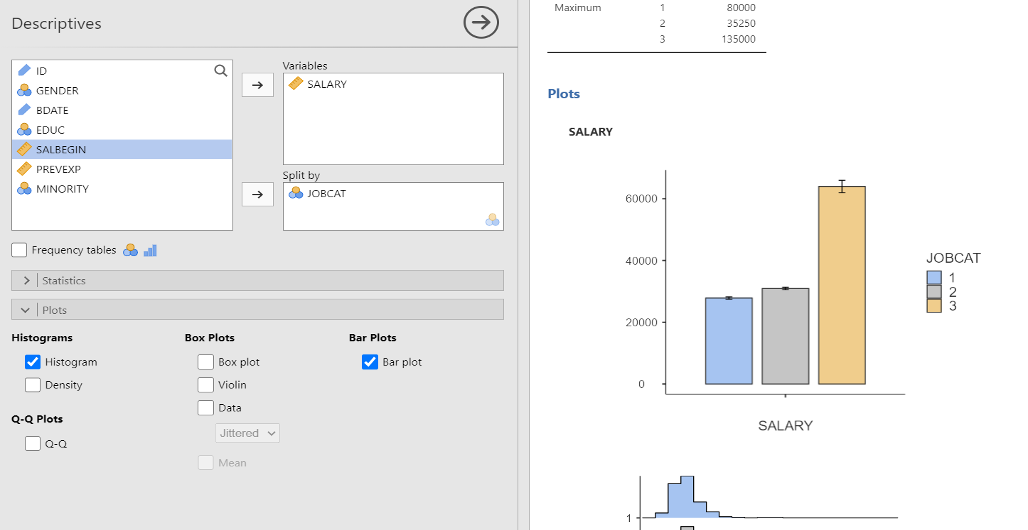
On the same screen click ‘plot’ and then tick the box for histogram and bar plot. You’ll see the graphs appear in the screen to the right. Have a play around with the different options and see what you can produce.
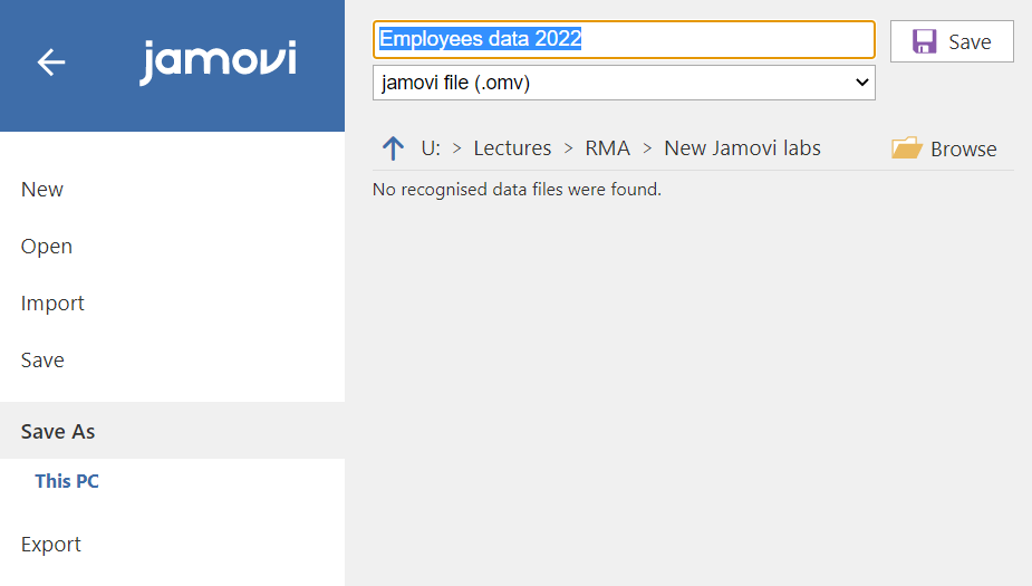
7. How to save your work in Jamovi
In JAMOVI Click on the 3 horizontal lines in the top left corner to File > Save as.
Give the file an appropriate name and click on ‘Browse’ to decide where you want to save it – then just click on ‘Save’