Week 2 : Item Analysis (also often called Reliability Analysis)
Learning Objectives
When you have completed this workshop, you should be able to:
- Decide what action(s) to take when addressing issues with an item analysis/reliability analysis
- Use Jamovi to recode any questions in a questionnaire that have been negatively phrased
- Use Jamovi to conduct an item analysis in order to understand how well each question contributes towards the measurement of psychological construct (e.g. an attitude).
- Better understand the reliability (internal consistency and test-retest reliability) of a questionnaire.
Item analysis and Cronbach’s alpha
Jamovi does not offer a built-in, dedicated procedure specifically labelled as “item analysis.” However, you can perform item analysis and calculate Cronbach’s alpha indirectly using Jamovi’s available statistical analyses, by conducting a “reliability analysis”. Through this analysis, you can obtain Cronbach’s alpha coefficient, indicating the internal consistency of the questionnaire (e.g. how well your items correlate with the total of the questionnaire). Additionally, you can explore item-total correlations to assess how each item correlates with the total score of the questionnaire.
This process allows you to evaluate the impact of individual items on the questionnaire’s internal reliability.
Cronbach’s alpha is based on two key ideas:
- If the items on a questionnaire fit together coherently, they should all correlate with the total score on the questionnaire. (In such a case alpha would be close to 1.0).
- If an item makes a useful contribution to a questionnaire, the scores on the item will correlate with the questionnaire total.
A reliable quesionnaire should have a Cronbach’s alpha of ≥ .7
In Jamovi, when assessing the reliability of a questionnaire, achieving a Cronbach’s alpha of ≥ .7 is considered indicative of a reliable instrument. If the calculated alpha falls below this threshold, we conduct an item analysis to identify potential issues contributing to the low reliability (note that this can include additional item vetting, as covered last week).
Always keep a clean copy of your data before any changes in case something goes wrong! Save a new version with your changes to keep track of what has changed.
When trying to improve the reliability of our questionnaires, we look for: 1. Any items which are negatively worded. They will need to be reverse scored. We reverse score those items ONCE (and only once per analysis) and then rerun the reliability analysis to see if Cronbach’s Alpha increases. 2. Any items which have an ‘Alpha if item deleted’ which is higher than the scales current Cronbach’s Alpha. Working from highest to lowest, remove one item at a time from the list of items entered into the reliability analysis and re-run the reliability analysis to see what happens to Cronbach’s Alpha. 3. Stop when Cronbach’s Alpha is .7 or above.
The table below presents a number of situations you may be faced with when conducting an item analysis on your questionnaire. It also provides advice about how to proceed.
| Situation | Notes | Action |
|---|---|---|
| Negative item-total correlations | An item is negatively correlated with the total. It has either been coded incorrectly OR it is not measuring what it should be OR it is not contributing to the total score | Check the wording. Recode the item ONCE if it is negatively worded. If it is not negatively worded, delete it. |
| Small item-total correlations and poor reliability | Once all items are positively correlated with the total, but alpha for the whole questionnaire is low (less than .7), the questionnaire has poor reliability. You need to weed out items that do not ‘belong’ to the overall scale. These will generally have a low item-total correlation and a value of alpha-if-deleted that is higher than the current alpha for the scale as a whole. | Delete the item because it is not contributing towards the questionnaire and reliability might improve without it. |
| Item keeps switching sign | Never re-code an item for a second time. These items will probably also have weak item-total correlations and high alpha-if-deleted values. | Delete the item, it is not working how you intended it to work. |
| Weak items in a reasonably good measure | It is possible for a measure with alpha > .7 to contain some items that are still rather weak. These are identified (among other things) by weak item-total correlations. They contribute little to the measure overall. | You will need to decide if there is a good reason to keep the item. If there isn’t a good reason to keep it, delete it. |
Self-esteem questionnaire
The following presents the items from a self-esteem questionnaire. A high score on this questionnaire corresponds to a high level of self-esteem.
Some of the items have been borrowed from the Rosenberg Self-Esteem Scale others were made up for this exercise. The scale is based on a 5-point Likert scale (ranging from ‘strongly disagree’ to ‘strongly agree’) with a high score corresponding to high self-esteem.
For each item make a note in the columns for question type and valence as follows:
- Question type: Does the item address the construct under investigation (self-esteem)? If it does, put ‘i’ for ‘item’ in the question type column. If it does not, put ‘d’ for ‘dummy/filler question’ in the question type column.
- Valence: Is this item positively or negatively worded in relation to the construct under investigation? ‘Positive’ means that a high score on this item corresponds to high self-esteem. ‘Negative’ means that a low score on this item corresponds to a high self-esteem. If the item is positive, put ‘+’ in the valence column. If the item is negative put ‘-’ in the valence column. The first one has been done for you to as an example.
| Items: | Question type: | Valence: |
|---|---|---|
| 1: Overall I feel that I am a success | ||
| 2: On the whole, I am satisfied with myself | ||
| 3: At times I think I am no good at all | ||
| 4: I need time to think before making a decision | ||
| 5: I feel that I have a number of good qualities | ||
| 6: I am able to do things as well as most other people | ||
| 7: I can work well even though I am tired | ||
| 8: I feel I do not have much to be proud of | ||
| 9: I certainly feel useless at times | ||
| 10: I like to work in a tidy environment | ||
| 11: I feel that I am a person of worth, at least on an equal plane with others | ||
| 12: I wish I could have more respect for myself | ||
| 13: At times I feel very worthwhile | ||
| 14: All in all, I am inclined to feel that I am a failure | ||
| 15: I take a positive attitude towards myself | ||
| 16: I feel depressed on rainy days |
Performing an item analysis using Jamovi
This section takes you through all the steps that you need to perform in an item analysis/reliability analysis of a questionnaire or scale. For part of this, a worked example based on the self-esteem questionnaire presented above is used. Use the “esteem” data file and import this into Jamovi (we covered how last week) then follow the instructions carefully.
Check your initial Cronbach’s alpha
In Jamovi, go to Analyses > Factor > Reliability Analysis
A new window will appear to the right called “Reliability Analysis”
Move all of the items over to the item box
Ensure Cronbach’s alpha, mean and standard deviation are ticked under scale statistics
You will now see these statistics on the right side of your screen
Now also select Cronbach’s alpha under item statistics and click Correlation heatmap under additional options
You now have everything you need for your reliability analysis to begin
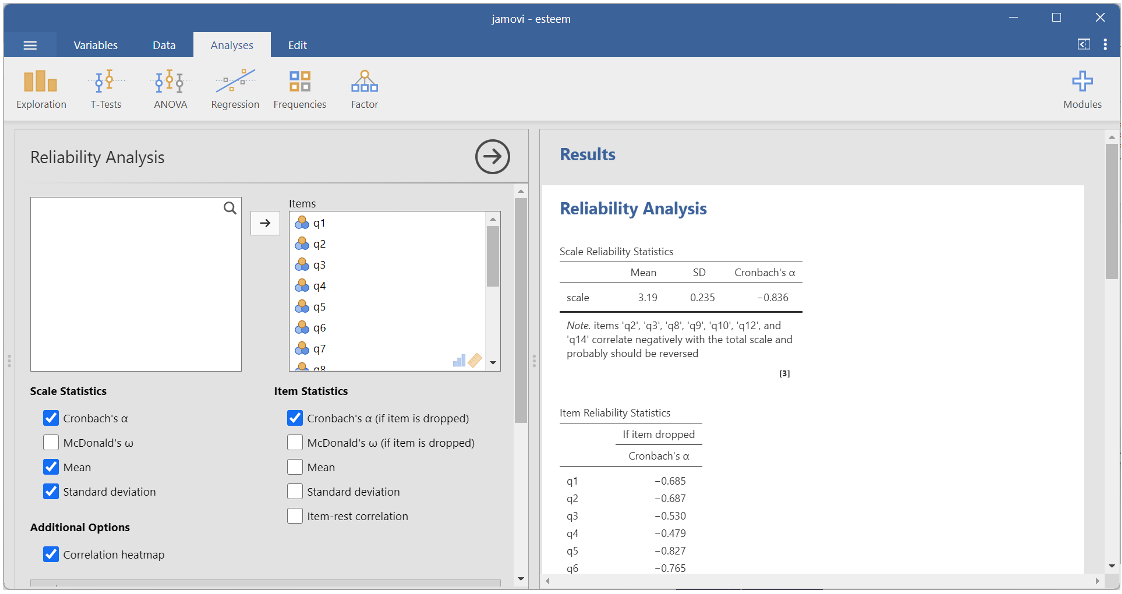
We can see that our initial Cronbach’s Alpha is -.836. Therefore, it is already over .7 (remember that this number can be positive or negative). The mean is 3.19 and the standard deviation is .235, which on a 5 point scale suggests participants are selecting the middle or neutral option.
However, we can also see a note under the scale reliability statistics box recommending that we reverse score the following items: Q2, Q3, Q8, Q9, Q10, Q12 and Q14. This is just a recommendation, you need to be the one who makes the decision so check back over the previous task to see which items were negatively worded.
The decision process I (Emma) would follow is;
- Q2 – Does not appear to be negatively worded. We will leave this alone for now.
- Q3 – Is negatively worded so will need to be reverse scored.
- Q8 – Is negatively worded so will need to be reverse scored.
- Q9 - Is negatively worded so will need to be reverse scored.
- Q10 - Does not appear to be negatively worded. We will leave this alone for now.
- Q12 - Is negatively worded so will need to be reverse scored.
- Q14 - Is negatively worded so will need to be reverse scored.
Luckily, Jamovi gives us an option to reverse score items on the same screen as the reliability analysis. You can just transfer the items you want to reverse scale from the Normal Scales Items box to the Reverse Scaled Items box as shown below.
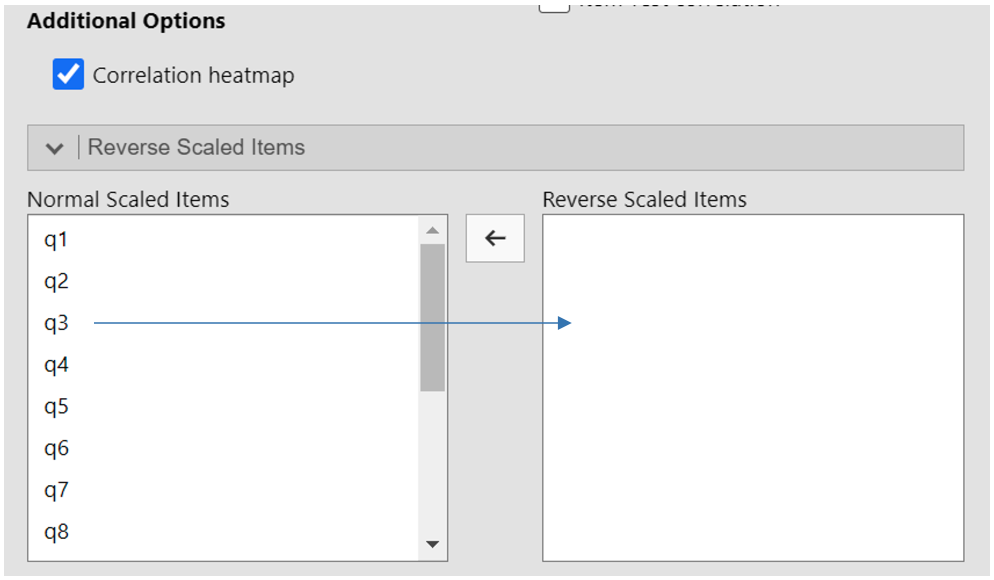
After checking Jamovi’s recommendation against the actual wording of the items, I would reverse score items 3, 8, 9, 12 and 14 so I would transfer those items to the Reverse Scaled Items box. Items 2 and 10 were not negatively worded so I have not reverse scored those and I will make a decision about what happens to them after the next step.
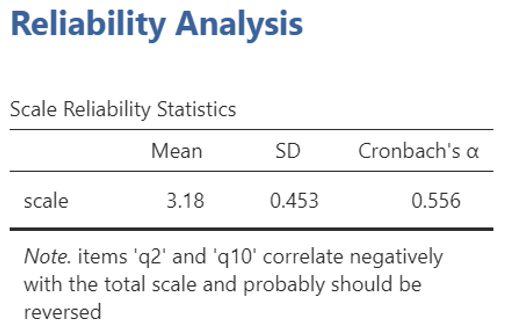
We can see from the reliability analysis that Cronbach’s has now dropped to .556 so it is below the threshold we are hoping to achieve (.7) and is not currently a reliable instrument but at least our items are now positively correlated to the total for the questionnaire.
Q2 and Q10 are still showing as negatively correlated with the total for the questionnaire, but they are not negatively worded so should not be reverse scored. Instead, I have moved them out of the reliability analysis to see what happens if I remove them from the questionnaire, because they do not appear to be working how I thought they would.
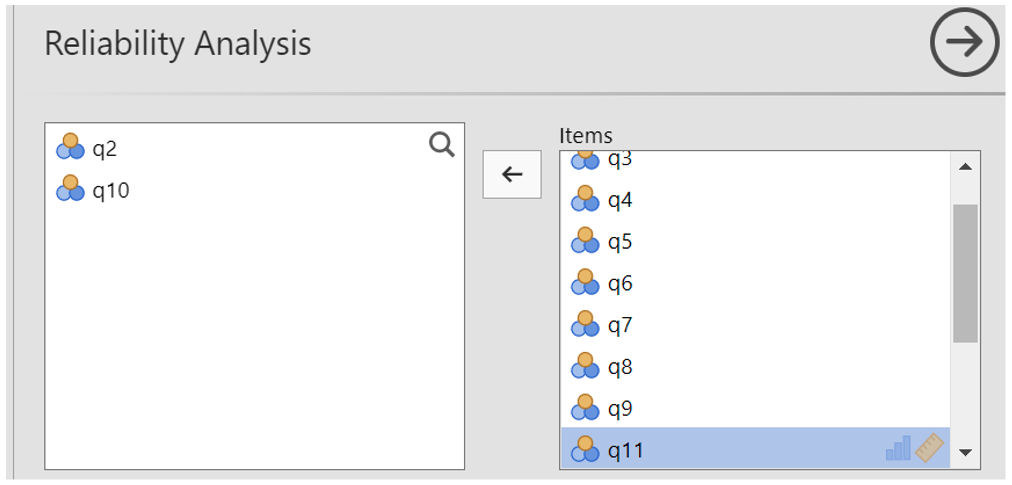
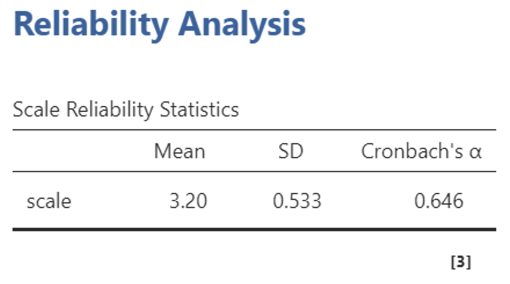
We can see that by removing those two items, Cronbach’s alpha has improved and is now reading as .646 (still technically below .7 but closer and it would meet the criteria if we round up).
I now check the Item Reliability Statistics to see if any other items could be removed to improve my Cronbach’s alpha.
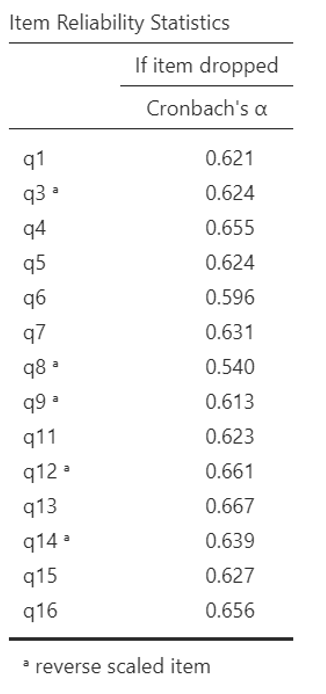
Q13 would have the biggest impact, but this item is worded “At times I feel very worthwhile” which does appear to be related to self-esteem. The reverse coded version of Q14 also appears to be related to self-esteem because it is worded “I wish I could have more respect for myself”.
Q16 is a strangely worded question as “I feel depressed on rainy days” because this is more situational. Therefore, I have decided to remove Q16 from the reliability analysis to improve my Cronbach’s alpha (now .656 so definitely meeting the criteria if we round up).
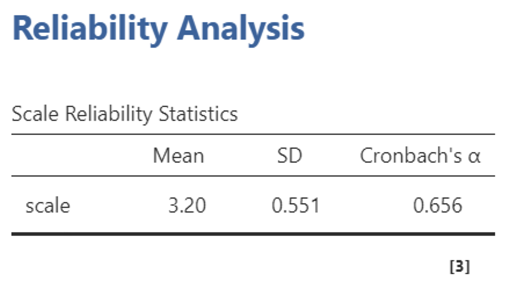
This isn’t perfect, because it is still slightly lower than .7 (unless rounded up) but I’ve removed three items which were not working in my questionnaire so it is more concise and I would continue to develop the instrument as data collection continues. I would then remove those three items from the second version of my questionnaire before I collect time 2 data.
An important point to consider is that you should only ever recode an item once during an item analysis/reliability analysis and this is the method I prefer to use because it allows me to explore the data and make decisions based on what the data is telling me. However, some researchers prefer to recode their negatively worded items before running the item analysis and you can see how to do that below. I recommend using one approach consistently, but it is up to you which.
Alternative Approach: Recoding items before running an item analysis/reliability analysis
Import the esteem data file into Jamovi. You can now recode the items you identified as negatively worded in task.
KEY TIP: Remember that when working with questionnaire data, you should save a copy of the ‘raw data’ which you do not change. Continue to work with a second ‘working’ copy so that you keep your original data safe (if something goes wrong, you will have a backup copy of your original data).
On the working copy: Recode items with negative wording or with a coding that is back to front (i.e. where a high score on the item should correspond to a low overall score on the questionnaire) before starting the item analysis. Recode into new variables (e.g. create new variables but keep the original one too) so that the original data remains intact.
Using Jamovi to recode a variable before item analysis/reliability analysis
In the Jamovi Variables tab, select all of the items you want to recode by ticking the box next to their names (note that the ‘variables’ are the questionnaire items).
Next click on Data > Transform
Add a name Jamovi can use to identify recoded variables e.g. Reversed or Rev Coded.
Where it says, ‘using transform’, click and select “Create New Transform”. This will create new rows of data for your recoded variables. Note that if you have already reverse scored some of the items and the ones you want to recode now are on the same scale, you can just select the transform settings you created earlier.
To add a new recoding condition, click on “+ Add recode condition” button.
Tell Jamovi what the original and new values should be: e.g.
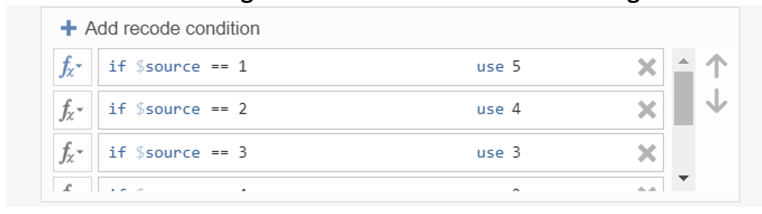
- You will see that Jamovi has created new columns of data for the reverse scored items next to the original items
After you have recoded the items you thought were negatively worded you can run the reliability analysis/item analysis in the same way (using the positively worded items and recoded versions of the negatively worded items). Remember not to recode an item more than once or you will get stuck in a loop and forget what you have done!
Note that you may also need to use this recoding method to reverse score negative items before you calculate participants total scores in week 3/4.
Removing Additional Weak or Inconsistent Items
Sometimes we need to continue removing items to improve Cronbach’s alpha and reduce the length of your questionnaires. You can continue to interpret the reliability analysis to see if any other items can be removed and you can also use item vetting as covered last week.
Deleting items
Once recoding is completed, the deletion stage begins regardless of which approach you took. Items should be deleted one at a time, starting with the one that has the best “If dropped Cronbach’s Alpha” (e.g. the item which would improve Cronbach’s Alpha the most if deleted). After each deletion, check Cronbach’s alpha.
As a ‘rule of thumb’ continue deleting items until the current Cronbach’s alpha exceeds 0.7.
Ties
Sometimes two items will have the same “if dropped Cronbach’s Alpha”. Which should you delete first? To decide:
- Look at the question wording and delete the one with the worst wording.
Or
- If both wordings seem good, delete the item which has the slightly higher “if dropped Cronbach’s Alpha”.
Make notes in the table below to keep track of what you have done to the items (e.g. reverse or remove). Note that there isn’t one current answer to this task, it depends on the decisions you have made and it is absolutely fine if your results are different to the people next to you as long as you know what you have done.
| Items: | Recoded | Removed |
|---|---|---|
| 1: Overall I feel that I am a success | ||
| 2: On the whole, I am satisfied with myself | ||
| 3: At times I think I am no good at all | ||
| 4: I need time to think before making a decision | ||
| 5: I feel that I have a number of good qualities | ||
| 6: I am able to do things as well as most other people | ||
| 7: I can work well even though I am tired | ||
| 8: I feel I do not have much to be proud of | ||
| 9: I certainly feel useless at times | ||
| 10: I like to work in a tidy environment | ||
| 11: I feel that I am a person of worth, at least on an equal plane with others | ||
| 12: I wish I could have more respect for myself | ||
| 13: At times I feel very worthwhile | ||
| 14: All in all, I am inclined to feel that I am a failure | ||
| 15: I take a positive attitude towards myself | ||
| 16: I feel depressed on rainy days |
Writing up an item analysis and Cronbach’s alpha
In a report an item analysis might be presented like this.
“An item analysis was performed on the original twenty-four items in the measure to test the reliability of the scale. This revealed an initial Cronbach’s alpha of -.836. Five items were reverse scored, which generated a new Cronbach’s alpha of .556. Three items were subsequently deleted because they were not correlating with the questionnaire total in the expected direction or they were not contributing very much towards the reliability of the instrument. The reliability of the remaining twenty items was good (a = .656) but suggests that further adaptation is needed in future research.”
Help! My Cronbach’s alpha is different, what did I do wrong?
You might not have done anything ‘wrong’. There is a degree of subjectivity in item analysis (e.g. interpreting how questions are worded and making decisions about how best to resolve any issues). Two researchers can look at the same question and interpret it differently or make a different decision about whether to recode or remove the item. This means that your Cronbach’s alpha might be different to the person sat next to you. As long as you know what you have done and can explain why you made those decisions, your item analysis is fine!
At this stage of your research methods training, you need to understand and accept that there often isn’t one ‘correct’ way to analyse data. Instead, there are often several potential approaches, which vary in appropriateness depending on how well they test your hypotheses and help you to achieve your aims. What we want to see is transparency: What have you done and why did you do it this way?
Self-efficacy – additional practice
If you would like additional practice, you can conduct another reliability analysis on the ‘efficacy’ data file. This contains fictional data from a scale to measure self-efficacy towards exercise. Each item was measured on a 10-point scale (coded 0-9) and there were 16 items in total. Item wording is not important here. Run a reliability analysis recoding and removing items as appropriate until the scale is sufficiently reliable. Take notes as you go to keep track of what you have done and stop as soon as alpha exceeds 0.7.
Calculating total scores for a questionnaire (or a subscale in a questionnaire)
Total scores are often needed to work with questionnaires.
A ‘questionnaire total’ refers to the total score someone achieved on a complete questionnaire (e.g. self-esteem or efficacy might be examples of this). A ‘subscale total’ refers to a total score someone achieved on a discrete section of a questionnaire (e.g. ‘Openness to experience’ is one of five subscale in questionnaires which measure the ‘Big Five’ personality traits).
Using Jamovi to calculate a questionnaire total
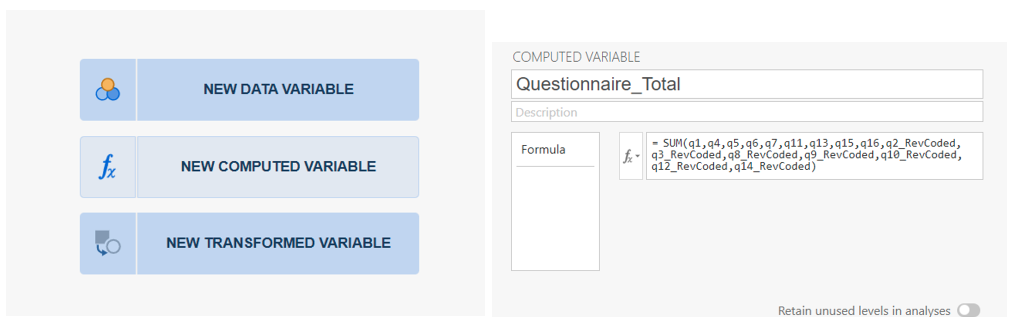
Select the blank cell where you want to create the new variable. Then click on “new computed variable”
A dialog box will appear prompting you to enter the name for the new variable. Give it a descriptive name, such as “QuestionnaireTotal”. In the formula box below the variable name, enter the formula to calculate the total score. This formula should sum up the scores of all the individual items in your questionnaire for each participant.
If you have recoded any of the items, remember to use the recoded versions, not the original data.
An example is provided in the screen shots below, based on the self-efficacy measure (e.g. it sums/adds together responses to all of the questions in the self-esteem questionnaire to find participants’ total scores and then adds these to the selected column).
If you want to calculate a ‘subscale total’ you would repeat this process but use an appropriate name for the subscale and only include the items on that subscale in the calculation.
Jamovi will create a new column of data containing the total scores so that each participant has a total score on the questionnaire.
Note that for your posters, you will need to have a Cronbach’s alpha for your time 1 data before you made any changes and also a Cronbach’s alpha for your time 1 data after you have finished making changes. You will also need Cronbach’s alpha’s for before and after changes based on your time 2 data to show the developing internal reliability of your questionnaire.