Week 3 : Factor Analysis
Learning Objectives
- Use Jamovi to conduct a Factor Analysis, interpret the output and write up the findings.
- Interpret Factor Analysis outputs from a theoretical standpoint.
Jamovi Tasks : Factor Analysis
Factor Analysis can be used to determine which individual questions/items cluster together in respondents’ answers to questions on a questionnaire. You can use this information to formulate sub-scales for your questionnaire and thus make it more useful. These subscales are usually called factors. For example, the PCL-R measures psychopathy and gives you a total psychopathy score. However, you can get sub measures, where some items of the PCL-R measure an emotional and interpersonal factor, while other items measure an antisocial behaviour and social deviance factor.
Factor analysis works by spotting relationships between items. If two items are highly correlated, they will be grouped into the same factor or sub-scale. If they do not correlate, they will be placed in separate factors or sub-scales. In using factor analysis, we try to get the smallest set of meaningful factors as possible to help us make sense of the pattern of our data.
Eigenvalue: a measure of the amount of variance explained by a factor. We often look for Eigenvalues > 1 (Kaiser’s criterion).
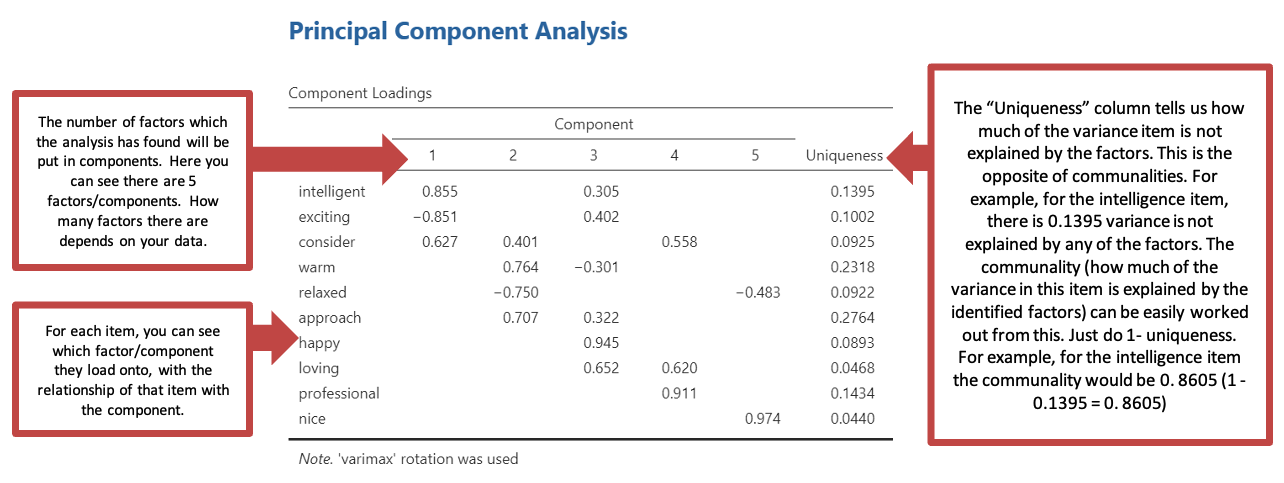
Communalities: we assume that in a factor analysis all variance is common variance. If all the variance due to a particular item is explained by the factor solution we work with, then that item should have a communality of 1. That is all the variance in the data is explained by the factors (group of items) that the analysis has identified. If the factor does not explain the variance in the data, its communality will be 0. In actual fact, after we have carried out a factor analysis, communalities will always be less than 1, as there will always be unexplained data. The closer they are to 1 the better. But if the communalities are very close to 0, it suggests that our factor analysis does not provide a good explanation of the variance in our data.
Factor Loading: is an output of the analysis. This is the correlation coefficient between an individual item and a particular factor. Factor loadings of 0.3 or higher may be considered of interest as a factor. You may want to only consider results with a factor loading of 0.5 or higher also, if it means that factors can be distinguished more neatly. The decision is somewhat subjective and depends on what your factor loadings look like.
Rotation: a way of tidying up your factors to make them easier to interpret. You may have identified some factors, but they are overlapping or difficult to interpret. Rotation is a way of cleaning up your data to make the factors easier to interpret.
Scree plot: a graphical representation of Eigenvalues. This can reveal how many factors it might be sensible to extract from your data.
Running a practice factor analysis using your repertory grid
You will find a repertory grid on the next page. Complete this grid according to the instructions below:
For each element, give a rating for the constructs between 0 (which corresponds to the negative end of the construct) and 9 (which corresponds to the positive end of the construct).
- E.g. If you see yourself as fairly approachable, give yourself a 7, if your least favourite lecturer is really unapproachable give them a 0.
- Use the full range of ratings for each construct if possible. (Without variability in the scores it will be difficult to use these data meaningfully).
The results you obtain from the analysis you perform on this data will be personal to you (e.g. your answers on the grid). The example output will not reflect your own data, this has been included to show you how to interpret your own results.
When you have completed the grid, create a new Jamovi data file and enter this data, but remember that the constructs on the grid are variables (columns) on and the elements are participants (rows). Once you have entered your rep grid data in Jamovi, carry out a factor analysis on the data as per the following pages.
Remember that your first Factor Analysis is based on the data you entered in the grid below. Your outputs and write-up will be different to the example in this course pack and the people next to you. This is normal and expected! Your analyses are not compared to anyone else’s analyses. You can only work with the data you have and researchers can approach data preparation and data handling differently (and as long as the analyses are appropriate and allow them to answer their research questions/test their hypotheses, this is fine). The analyses in your group poster presentation and individual report are marked based on their own merits (e.g. was the analysis appropriate? Did it allow them to answer their research questions/test their hypotheses? Have they reported and interpreted the analyses fully and correctly?).
| Me as I am | Me as I would like to be | Favourite lecturer | Least favourite lecturer | Library staff | Student services official | Personal tutor | Parent figure | Best friend | Neighbour | |
|---|---|---|---|---|---|---|---|---|---|---|
| Distant - approachable | ||||||||||
| Nasty - nice | ||||||||||
| Dull - exciting | ||||||||||
| Cold - warm | ||||||||||
| Tense - relaxed | ||||||||||
| Detached - loving | ||||||||||
| Unintelligent - intelligent | ||||||||||
| Sad - happy | ||||||||||
| Selfish - considerate | ||||||||||
| Unprofessional - professional |
Using Jamovi to carry out a factor analysis (Principal Components Analysis)
These instructions assume that you have data from a questionnaire or some other study entered in column format: that is one column for each item/question.
Factor analyses should be carried out on raw data – not on recoded data
Using your data file
Go to Analysis -> Factor -> Principal Component Analysis
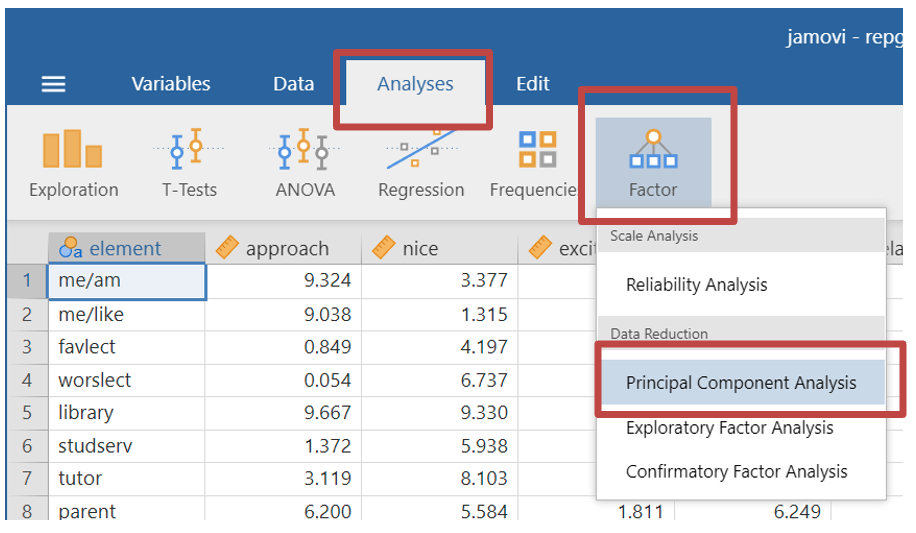
- Move all the items which you would like to include in your factor analysis (i.e., all the variables which you would like to see if they form a factor) into the variables box.
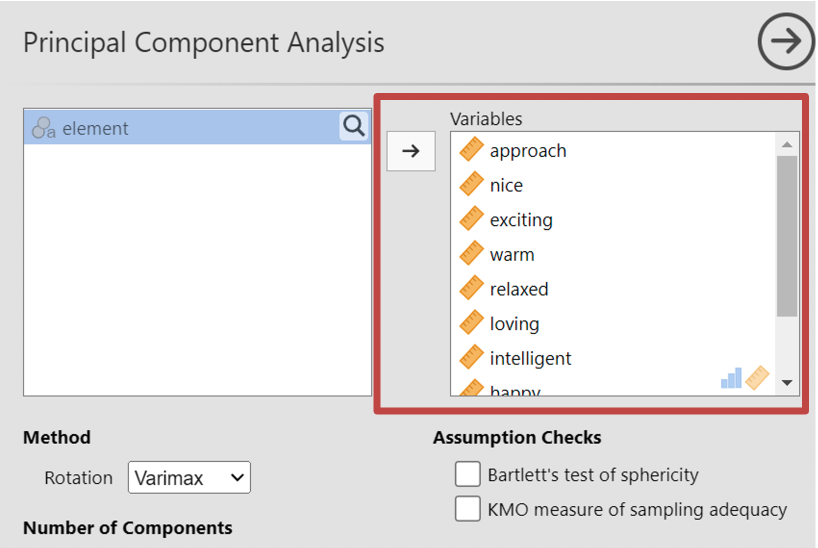
You will need to choose your statistical analysis, however Jamovi has some default options.
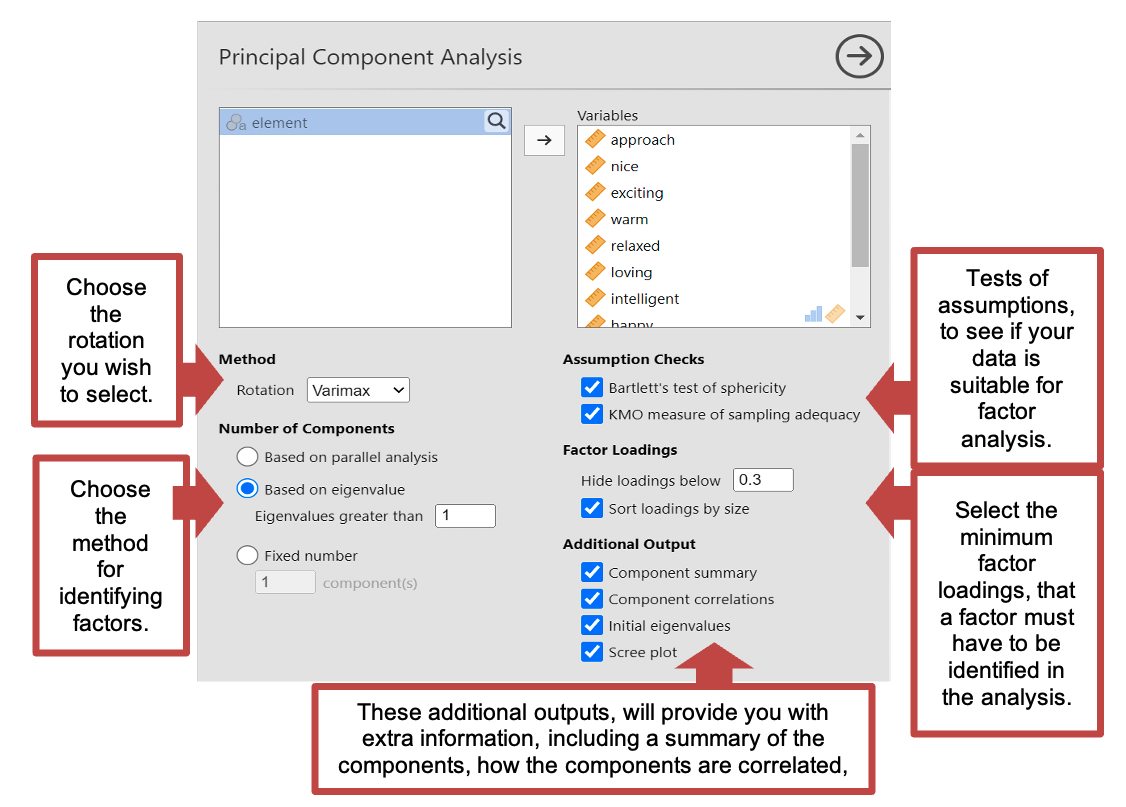
- Method - Rotation: This is the type of rotation you wish to select. For this data should select Varimax.
- Number of components: This is where you tell Jamovi how to determine the number of components or factors to identify. There are several options you can select from. For this data you should select “based on eigenvalue” making sure “Eigenvalues greater than 1” is input.
- Assumption checks: Here you can run two assumption checks to see if your data is suitable for a factor analysis. Including KMO which measures the strength of the interrelationships between items and the adequacy of the sample size. And the Bartletts test of sphericity, which tests whether the correlation matrix of the observed variables is significantly different from an identity matrix.
- Factor loadings: Here you can state the minimum factor loading output, for you to want to include the factor.
- Additional outputs: this includes Factor summary (which will tell us the % of variance accounted for by your factors), Factor correlations (to see how well the factors we identified as correlated using a correlation matrix), initial eigenvalues for each identified factors, and a scree plot to see the eigenvalues of each component visually.
Output: Principal Component Analysis
The example output for a Principal Components Analysis is based on a completed repertory grip like the one you should complete earlier. Your results will probably look different, but given that the data will be directly relevant to you, this will make the analysis easier to interpret.
- Under “Component Loadings” you will be able to see how many factors (also known as components) have been identified in your data through the analysis. While there is 5 in the below analysis, this depends on your data, and may not be the same. You can also see for each individual item, how they load onto each factor (only when it is higher than the minimum factor loading you selected, in this case 0.3) and how much of the variance in each item is unexplained by any of the factors (which will help you work out the communalities). This analysis gives you post rotated data.
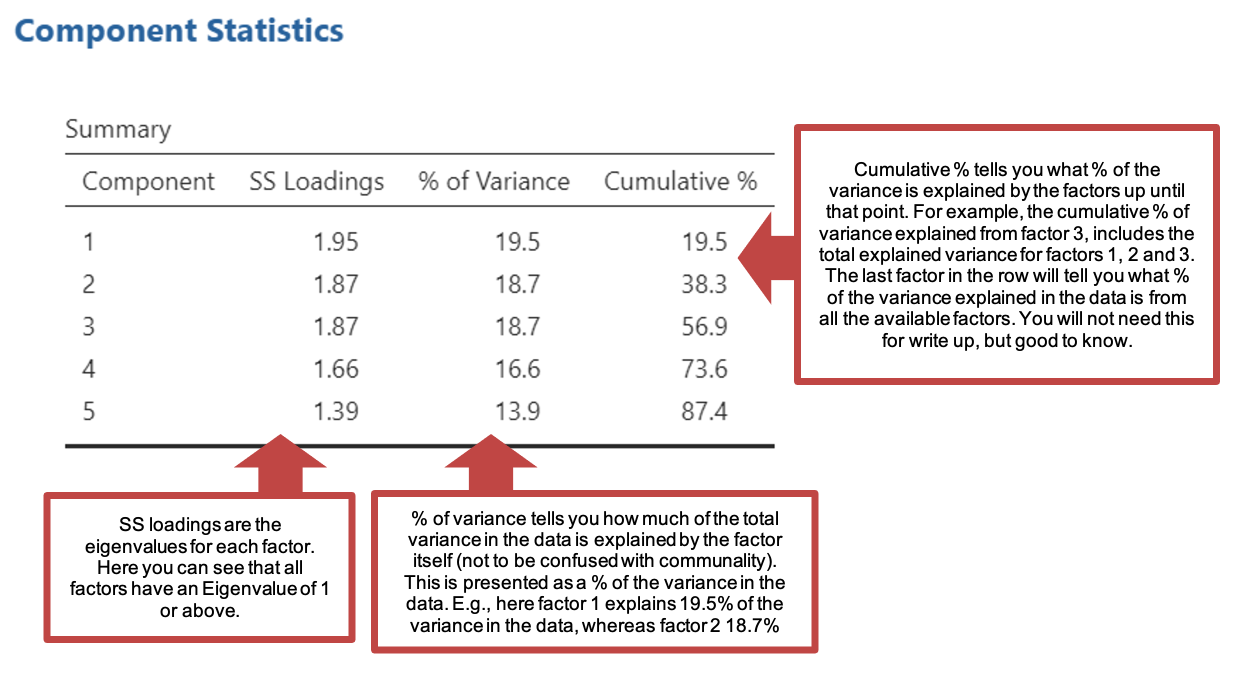
- Under “Component Statistics” You can see how much of the variance of all the data is explained. Remember you must have ticked component summary in the statistics section to see this.
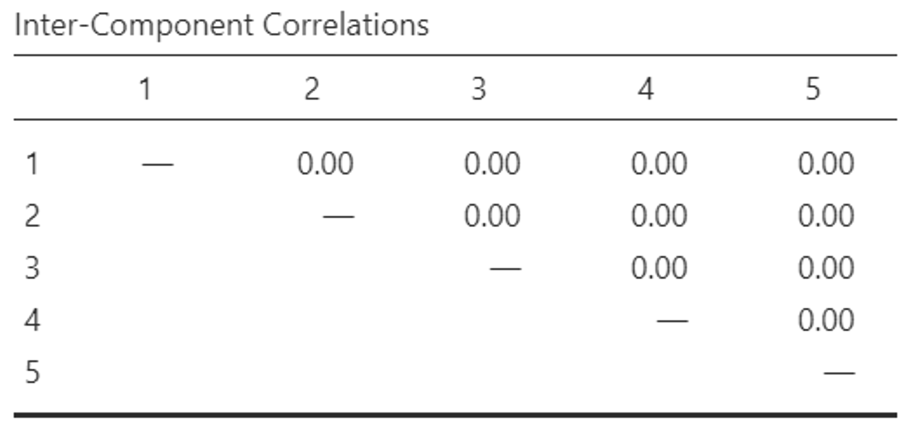
- You can view the “Inter-Component Correlations” matrix, which tells us how much each of the factors created are correlated with each other. You can see below that the factors within this data are not correlated with one another. Your data will likely be different.
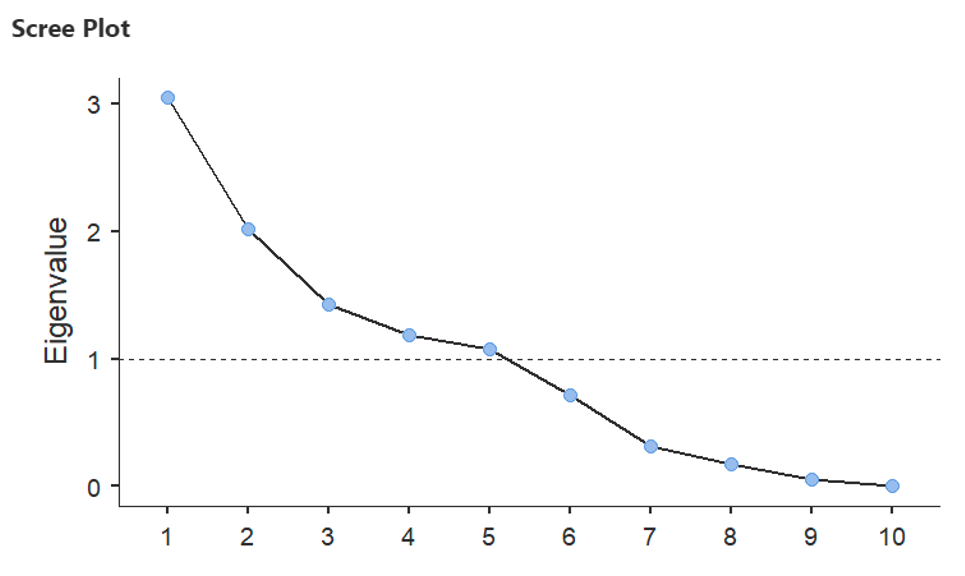
- You will also be able to see the screen plot below, which tells you how many of the factors have an Eigenvalue of 1 or above. You can see here; 5 factors had an Eigenvalue of 1 or above. Those 5 factors were provided to you in the tables described above. However, there were a further 5 factors which had an eigenvalue below 1 which were not provided in the analysis. Remember that your analysis will be different because you have different data!
Interpreting the factors
- Look at all the questions (or variables, or constructs in this case) that load onto each factor.
- Think about what each construct (or question) might mean on its own and then decide on a kind of ‘average’ meaning for the factor as a whole.
- In doing so, reverse the meaning of any questions (variables) with negative loadings.
- Give your factors meaningful names to capture what they represent.
Name the factors for your repertory grid. * There is no right or wrong answer, but since the data are directly relevant to you, you should be able to make sense of them. * Once you have named your factors, explain the factors to a fellow student (or a TA). * What can your factors tell you about how you perceive the constructs on the grid to relate to people? * Have your factors got anything in common in terms of what you see in people compared to your fellow students?
Subscale totals
Once you have extracted and interpreted the factors, you can work out subscale totals for each factor on the questionnaire.
- The subscale total is worked out by adding together the item scores for all the items that load onto a particular factor.
- For the rep grid above, the factor scores for factor 2, for example, would be calculated by adding together the scores (out of 9) for Tense – Relaxed and Sad – Happy giving a joint score out of 18.
- As with a questionnaire total, negative items need to be recoded before calculating the subscale total, so that a high score on a positive item point towards the same ‘end’ of the overall scale as a low score on a negative item. (e.g. On an attitude-towards-statistics scale, strong agreement on a 5-point Likert scale on “I love stats” would be scored as 5 and strong disagreement on a 5-point for “I hate stats”, would be scored as 5. Thus adding the question scores together for a ‘stats-fandom’ subscale total would correspond to a 10 indicating high stats-fandom and a 2 indicating low stats-fandom).
Writing up Factor Analysis Results
Using an example repertory grid analysis below, here is an example write-up:
“An exploratory factor analysis was performed on the repertory grid data to see how the different constructs were related to each other. Using principal components extraction and Kaiser’s criterion (Eigenvalues > 1), three factors emerged and were adjusted using a varimax rotation. Together the factors explained 85% of the variance observed. The first factor, which accounted for 39% of the variance, was labelled ‘Affability’. A high score on this factor is related to agreeable and prosocial traits displayed by a person. The second factor accounted for a further 25% of the variance and was labelled ‘Cheerfulness’. This is related to a person’s apparent happiness and sense of relaxation. The third factor accounted for 22% of the variance. It was called ‘Intellectual appeal’ and was associated with a person’s intellect, exactingness, and professional values (see Table 1 for factor loadings).”
| Factor 1: Affability | Factor 2: Cheerfulness | Factor 3: Intellectual appeal | |
|---|---|---|---|
| Cold - warm | .911 | ||
| Selfish - considerate | .852 | ||
| Detached - loving | .843 | ||
| Distant - approachable | .842 | ||
| Nasty - nice | .838 | ||
| Tense - relaxed | .954 | ||
| Sad - happy | .931 | ||
| “Thick” - intelligent | .861 | ||
| Dull - exciting | .755 | ||
| Unprofessional - professional | .732 |
Health questionnaire factor analysis
The file ‘health’ contains some made-up data from a questionnaire on health. There were 8 questions in all; they are listed below. The questions have been scored such that answers indicative of good health score highly. So for question 1, an answer of ‘strongly agree’ scored 5 whereas for questions 4 and 5 an answer of ‘strongly disagree’ scored 5. Open the file and carry out a factor analysis on the data answering the following questions as you go.
List of items in the Health questionnaire
- I often visit the doctor
- I often suffer from colds
- I feel nervous in crowds
- I am always stiff in the mornings
- I can’t sleep a night before a big meeting at work
- I feel very tired at the end of the day
- I often go back to check that the front door is locked when I leave the house
- Most things in life make me anxious
Based on your analysis of the health questionnaire:
How many factors can be extracted from these data?
How much of the overall variance does the factor analysis explain? %
Based on the Component Loadings matrix, write down the items which load on each factor in descending order of loading size. Note also the direction (positive or negative) of each factor loading which you report.
Factor 1
Question: Loading size: Direction:
Question: Loading size: Direction:
Question: Loading size: Direction:
Question: Loading size: Direction:
Question: Loading size: Direction:
Factor 2
Question: Loading size: Direction:
Question: Loading size: Direction:
Question: Loading size: Direction:
Question: Loading size: Direction:
Given the list of questions, interpret the meaning of each factor and write them down.
Factor 1:
Factor 2:
Factor 3:
Personality questionnaire factor analysis
Open the data file ‘personality’. The items in the questionnaire come from the International Personality Item Pool (IPIP) and the data was collected from several cohorts of University of Birmingham 2nd year Psychology undergraduates. Run a factor analysis on the data in this file.
When you run the analysis, Jamovi might say something like ‘this analysis has terminated, likely due to hitting a resource limit’. If this happens it is likely that the box ‘based on parallel analysis’ is ticked under ‘number of components’. If you change this to ‘based on eigenvalue’ then it should work.
Based on your analysis of the personality questionnaire:
How many factors does the computer initially extract?
How many factors would you extract based on the scree plot?
Rerun the factor analysis, but this time set the criteria to extract 5 factors. You can do this in the ‘Number of Components” section: instead of selecting ‘based on eigenvalues’ select ‘fixed number’. Set this to 5.
- The questionnaire is based on a trait model of personality called the ‘Big Five’ (Costa & McCrae, 1986). The Big Five are:
- Openness to experience (or intellect)
- Conscientiousness
- Extraversion
- Agreeableness
- Neuroticism (or emotional stability)
Look at the rotated factor matrix and use 0.5 as your cut-off for factor loadings to be considered to belong to a factor. Match up your extracted factors to the factors described by Costa and McCrae. (you may want to make a note of what the items are by renaming the variables).
Factor 1:
Factor 2:
Factor 3:
Factor 4:
Factor 5:
Note that in computer practical’s 4 and 5 you will be analysing your pilot data and working on your poster presentations. This will require use of item vetting, item analysis and factor analysis. Note that this course pack has walked you through principle component factor analysis but there are also two other versions of factor analysis called exploratory factor analysis (when you are not sure how many factors there are in a questionnaire) and confirmatory factor analysis (when you want to confirm that a questionnaire has the expected number of factors such as the big 5 personality traits). The other two forms of factor analysis are quite similar and you can find various guides and demonstrations online. You can use any of these factor analyses for your poster presentations – just remember to justify why you have chosen the approach that you have used.